Missouri Bankers Association Annual Convention

2021 Missouri Bankers Association Annual Convention

July 13-16, 2021

Missouri Bankers Association Annual Convention & Trade Show

Chateau on the Lake Resort Spa & Convention Center, Branson, MO

Aunalytics is attending the 2021 MBA Annual Convention as a Gold Sponsor

Aunalytics, a leading data platform company delivering Insights-as-a-Service for enterprise businesses, will join the upcoming Missouri Bankers Association Annual Convention as a Gold Sponsor, July 13-16 in Branson, MO. Aunalytics will feature its Daybreak™ for Financial Services solution with advanced analytics that enable bankers to more effectively identify and deliver new services and solutions for their customers for greater competitive advantage.

Missouri Bankers Association Annual Convention

External Relationships Smart Feature

What are Smart Features?

Machine learning is a leading component of today’s business landscape, but even many forward-looking business leaders in the mid-market have difficulty developing a strategy to leverage these cutting edge techniques for their business. At Aunalytics, our mission is to improve the lives and businesses of others through technology, and we believe that what many organizations need to succeed in today’s climate is access to machine learning technology to enhance the ability to make data driven-decisions from complex data sources.

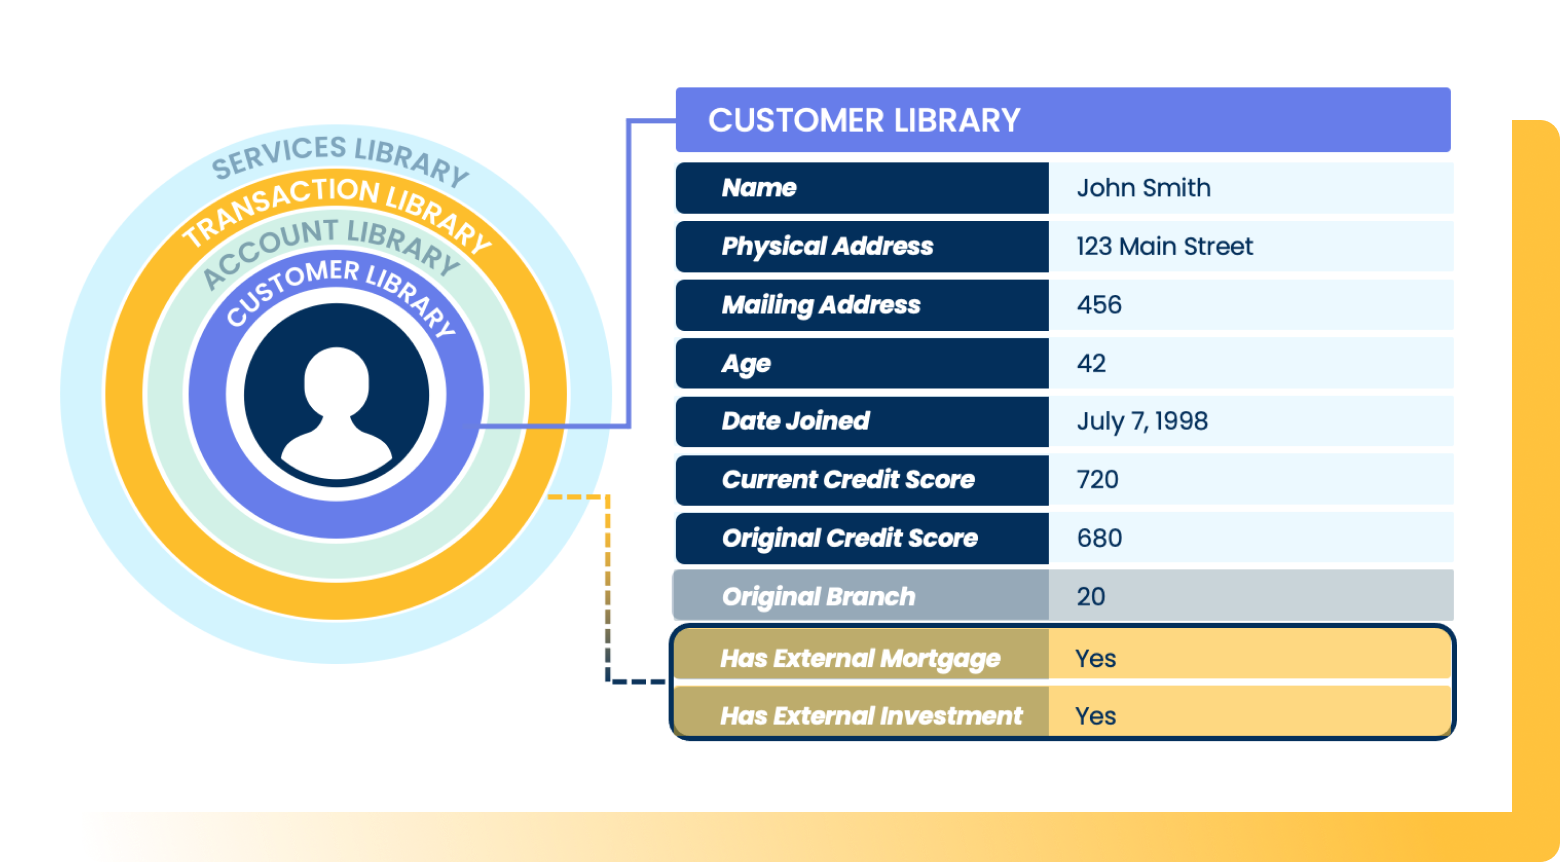
Imagine having the ability to look at a particular customer and understand based on past data how that individual compares in terms of various factors driving that business relationship:

  • Which of our products is this customer most likely to choose next?
  • How likely is this customer to default or become past due on an invoice?
  • What is churn likelihood for this customer?
  • What is the probable lifetime value of this customer relationship?

Aunalytics’ Innovation Lab data scientists have combed through data from our clients in industries like financial services, healthcare, retail, and manufacturing and have developed proprietary machine learning techniques based on a solid understanding of the data commonly collected by businesses in these sectors.

SHAP graph for loan default risk model

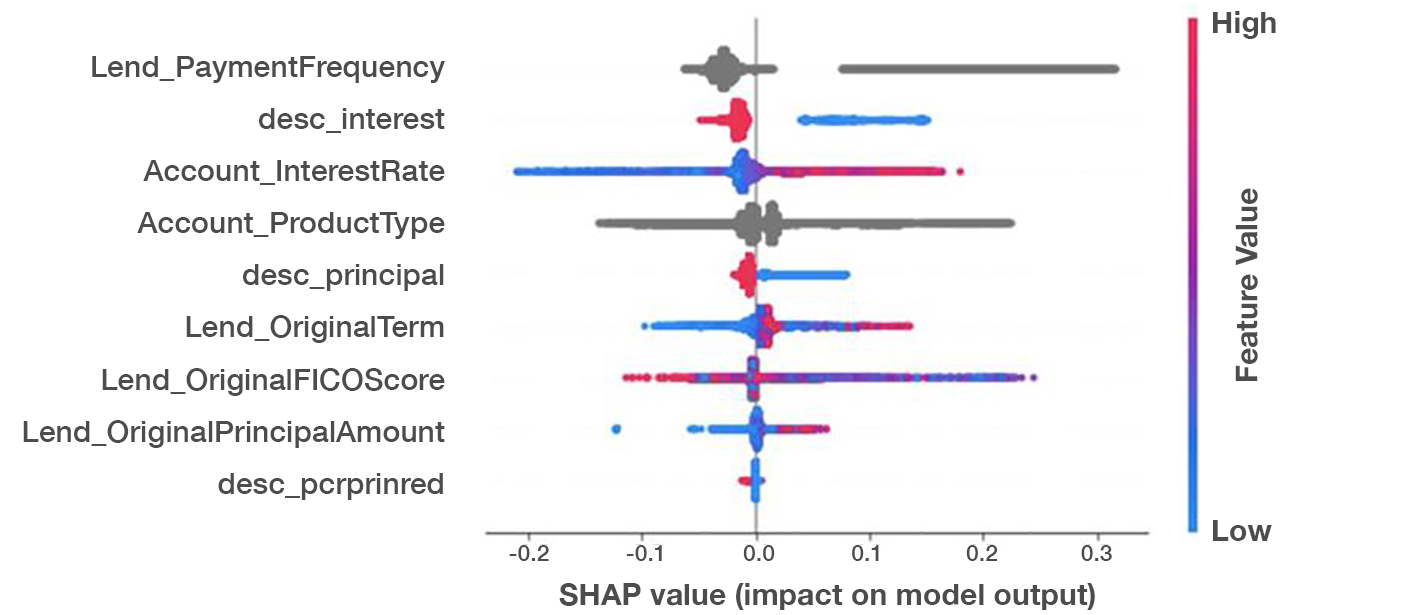
A SHAP (Shapley Additive Explanations) value chart for a remarkably accurate loan default risk model we developed shows which features have the highest impact on risk prediction.  

From this, we append insights gleaned from machine learning to data models. We add high value fields to customer records to reveal insights about a customer learned from our algorithms. Smart Features provide answers to pressing business questions to recommend next steps to take with a particular customer to deepen relationships, provide targeted land and expand sales strategies, provide targeted marketing campaigns for better customer experiences, and yield business outcomes.

Machine learning techniques enable more accurate models of risk, propensity, and customer churn because they represent a more complex model of the various factors that go into risk modeling. Our models deliver greater accuracy than simpler, statistical models because they understand the relationship between multiple indicators.

Smart Features are one way that Aunalytics provides value to our clients by lending our extensive data science expertise to client-specific questions. Through these machine learning enriched data points, clients can easily understand a particular customer or product by comparing it to other customers with similar data. Whether you want to know if a customer is likely to select a new product, their default risk, churn likelihood, or any other number of questions, our data scientists and business analysts are experienced and committed to answering these questions based on years of experience with businesses in your industry.

Learn more about Smart Features


End-to-End Data Analytics Solution Blog (1)

Where Can I Find an End-to-End Data Analytics Solution?

The data analytics landscape has exploded over the past decade with an ever-growing selection of products and services: literally thousands of tools exist to help business deploy and manage data lakes, ETL and ELT, machine learning, and business intelligence. With so many tools to piece together, how do business leaders find the best one or ones? How do you piece them together and use them to get business outcomes? The truth is that many tools are built for data scientists, data engineers and other users with technical expertise. With most tools, if you do not have a data science department, your company is at risk for buying technologies that your team does not have the expertise to use and maintain. This turns digital transformation into a cost center instead of sparking data driven revenue growth.

Data and AI Landscape

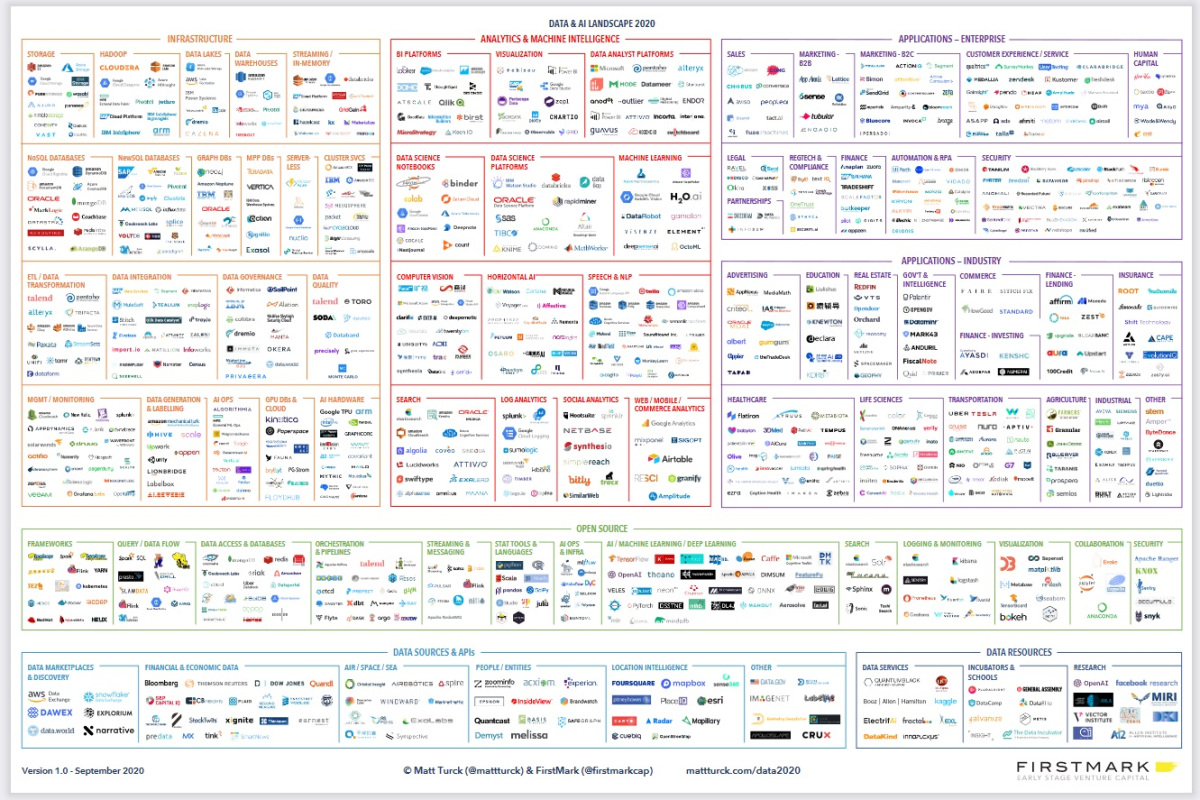
Image credit: Firstmark
https://venturebeat.com/2020/10/21/the-2020-data-and-ai-landscape/

Aunalytics' team of experts

Aunalytics’ side-by-side service model provides value that goes beyond most other tools and platforms on the market by providing a data platform with built-in data management and analytics, as well as access to human intelligence in data engineering, machine learning, and business analytics. While many companies offer one or two similar products, and many consulting firms can provide guidance in choosing and implementing tools, Aunalytics integrates all the tools and expertise in one end-to-end solution built for non-technical business users. The success of a digital transformation project should not be hitting implementation milestones. The success of a digital transformation project should be measured in business outcomes.


Customer Intelligence

Aunalytics’ Client Success Team Drives Measurable Business Value

Transitioning to a more data-driven organization can be a long, complicated journey. A complete digital transformation is more than simply adopting new technologies (though that is an important component.) It requires change at all levels of the business in order to pivot to a more data-enabled, customer-focused mindset. Aunalytics Client Success is committed to helping organizations digitally transform by guiding and assisting them along every step of the journey, and ultimately, allowing them to thrive.

Below, the Client Success (CS) team has answered some of the most common questions about what they do and how they help organizations achieve measurable business outcomes.

What is Client Success?

Aunalytics CS partners with clients to become their trusted advisor, by building a customized CS Partnership Plan utilizing the client’s unique business needs as the core goals. The CS Partnership Plan creates an exceptional client experience by consistently applying a combination of our team and technology to deliver measurable value and business outcomes for our clients.

What are the main goals of the Aunalytics Client Success team?

The Client Success team has four main goals:

  1. Designing targeted client experiences (by industry, product, and digital transformation stage)
  2. Recommending targeted next steps by simplifying and synthesizing complex information
  3. Delivering proactive and strategic support from onboarding to solution launch, ongoing support, and consulting
  4. Collecting and responding to client feedback on ways our service delivery can evolve

What are the various roles within the CS team?

There are two main roles within the CS team that interact with clients on a regular basis. The first is the Client Success Manager (CSM). The CSM manages day-to-day client tactical needs, providing updates and direction throughout the onboarding process. As the liaison between clients and the Aunalytics team, the CSM synthesizes complex information into clear actions, mitigates any roadblocks that may occur, and clearly communicates project milestones. The CSM works closely with the clients throughout their partnership with Aunalytics, from onboarding, adoption, support, and engagement.

The Client Success Advisor (CSA) works on high-level strategy with each client, translating Aunalytics’ technology solutions into measurable business outcomes. They partner with the clients’ key stakeholders to understand their strategic objectives and create a custom technology roadmap that identifies the specific steps necessary to reach their digital transformation goals. These goals are integrated into the client’s specific CS Partnership Plan to ensure we are aligned on objectives and key results, with clear owners, timelines, and expected outcomes.

How often can a client expect to hear from a CS team member throughout their engagement with Aunalytics?

The CS team is introduced to clients at the initial kickoff meeting and CSMs initiate weekly touch points to ensure onboarding milestones are being met and to communicate action items, responsible parties, and next steps. During these calls the CS team (CS Manager, CS Advisor, Data Engineer, & Business Analyst) will review the project tracker—highlighting recent accomplishments, key priorities, and next steps. Each item is documented, assigned an owner, a timeline, and clear expectations around completion criteria.

What is the Aunalytics “Side-by-Side Support” model and how does the CS team help facilitate this?

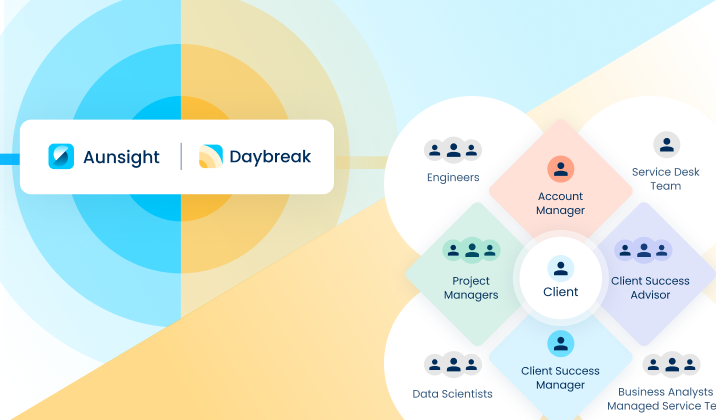
Our side-by-side service delivery model provides a dedicated account team, comprised of technology (Data Engineers (DE), Data Scientists (DS), and Business Analysts) and data experts (Product Managers, Data Ingestion Engineers, and Cloud Infrastructure Team), to help transform the way our clients work. The account team collaborates across the company, in service of the client, to ensure that everyone on the team is driving towards the client’s desired outcomes. The CSA captures this information in the CS Partnership Plan to ensure alignment, key priorities, and ownership of time-bound tasks.

The CS team partners with Aunalytics’ Product, Ingestion, and Cloud teams to share client questions, recommendations, and future enhancement ideas. The Partnership Plan is a custom document that evolves with the client’s ever-changing needs. The CSA reviews the Partnership Plan with the client every quarter to capture new goals, document accomplishments, and create feasible timelines for implementation. The goal of the CSA is to create a relationship with the client, in which they view the CSA as a key member of their internal team (e.g. the same side of the table vs. a vendor).

A successful partnership with Aunalytics’ Client Success team is when concrete business outcomes and value are realized by the client, through the use of Aunalytics’ solutions (products + service).

What are some examples of business outcomes that CS has helped Daybreak for Financial Services clients achieve?

In addition to guidance throughout the initial implementation of Daybreak, CS has assisted banks and credit unions with the execution of a number of actionable business cases, such as:

  • Assisting Financial Institutions with implementation of self-service analytics programs;
  • Improving collection and recovery rates on loans;
  • Implementing pattern recognition to make sure that risk and collection departments are efficiently targeting the most at-risk loans;
  • Creating data driven marketing programs to offer personalized services, next-best products, and onboarding. Data-driven marketing allows financial institutions to be more efficient with their marketing dollars and track campaign outcomes better;
  • Integration with 3rdparty software systems.

The Aunalytics Client Success team is instrumental in helping clients realize measurable business value. Together with Aunalytics’ strong technology stack, this side-by-side delivery model ensures that all clients are equipped with the resources they need to affect positive change within the organization and achieve their digital transformation goals.


Customer Intelligence

Artificial Intelligence, Machine Learning, and Deep Learning⁠

What Exactly is "Artificial Intelligence"?

If you use an automated assistant, make a simple Google search, get recommendations on Netflix or Amazon, or find a great deal in your inbox, then you will have interacted with AI (Artificial Intelligence). Indeed, it seems that every company and service today is incorporating AI in some way or another. But let’s dissect what the phrase ‘Artificial Intelligence’ means.

Most people would agree that AI is not so advanced that these companies would have Rosie from The Jetsons analyzing customer data or Skynet making product recommendations on their store page. And on the other end, at some level it is commonly understood that AI is more complex than simple business rules and nested ‘if this, then that’ logical statements.

Things start to get murky when other phrases, often conflated with AI, are added to the mix. Amongst these terms are Machine Learning (ML) and Deep Learning (DL). One company might say they use ML in their analytics, while another might claim to use DL to help enhance creativity. Which one is better or more powerful? Are either of these actually AI? Indeed, a single company may even use these words interchangeably, or use the overlap of definitions to their marketing advantage. Still others may be considering replacing an entire analytics department with DL specialists to take advantage of this new ‘AI Revolution’.

Don’t get swept up by the hype; let’s shine a light on what these terms really mean.

Teasing out the Differences between AI, ML and DL

These three terms⁠—Artificial Intelligence, Machine Learning, and Deep Learning—are critical to understand on their own, but also how they relate to each other; from a sales team explaining the services they provide, to the data scientists who must decide which of these model types to use. And while it is true that each of AI, ML, and DL have their own definitions, data requirements, level of complexity, transparency, and limitations—what that definition is and how each relate is entirely dependent on the context at which you look at them.

For example, what constitutes Machine Learning from a data acquisition perspective might look an awful lot like Deep Learning in that both require massive amounts of labeled data, while neither look at all similar in the context of the types of problems each can solve or even in the context that examines the skill sets that are required to get a specific model up and running.

For the purposes of this thought piece, the context we will be using will be the case of complexity—how the ability of each of Artificial Intelligence, Machine Learning, and Deep Learning simulate human intelligence and how they incrementally build on each other. This simulation of human intelligence, called simply machine intelligence, is measured by the machine’s ability to predict, classify, learn, plan, reason, and/or perceive.

The interlink between Artificial Intelligence, Machine Learning, and Deep Learning is an important one, and it is built on the context of increasing complexity. Due to the strong hierarchical relation between these terms, the graphic above demonstrates how we at Aunalytics have chosen to best to organize these ideas. Artificial Intelligence is the first of the three terms as historically it originated first, as well as the fact that it is the overarching term that covers all work within the field of machine intelligence. AI, as we use it, can be best described in two ways. The most general case definition of Artificial Intelligence is any technique that enables machines to mimic human intelligence.

Indeed, it may seem that any number of things computers are capable of today could be seen as an AI, although the focus here is not the ability to do math or maintain an operating system⁠—these are not ‘intelligent’ enough. Rather, we are considering such application like game AI, assistive programs like Microsoft’s ‘Clippy’, and expert systems which must predict useful material or actions, classify tasks and use cases, or perceive user and environmental behaviors to drive some action. In short, they display machine intelligence.

The key here is that all of these things perform an activity that we might attribute with human intelligence⁠—moving a bar to follow a perceived ball in the classic video game Pong, classifying that you are writing what looks to be a letter and then provide a useful template, or predict an answer for you based on your current problems. In each scenario, the AI is provided some sort of input and must respond with some form of dynamic response based on that input.

Glossary


Artificial Intelligence (AI): Any technique that enables machines to mimic human intelligence, or any rule-based application that simulates human intelligence.

Machine Learning (ML): A subset of AI that incorporates math and statistics in such a way that allows the application to learn from data.

Deep Learning (DL): A subset of ML that uses neural network to learn from unstructured or unlabeled data.

Feature: A measurable attribute of data, determined to be valuable in the learning process.

Neural Network: A set of algorithms inspired by neural connections in the human brain, consisting of thousands to millions of connected processing nodes.

Classification: Identifying to which category a given data point belongs.

Graphics Processing Units (GPUs): Originally designed for graphics processing and output, GPUs are processing components that are capable of performing many operations at once, in parallel, allowing them to perform the more complicated processing tasks necessary for Deep Learning (which was not possible with traditional CPUs).

Reinforcement Learning: A form of Machine Learning where an agent learns to take actions in a well-defined environment to maximize some notion of cumulative reward.

Sampling: Within the context of AI/ML, sampling refers to the act of selecting or generating data points with the objective of improving a downstream algorithm.

Artificial Intelligence: Machines Simulating Human Intelligence

These kinds of activities are all rule-driven, a distinction that leads to our second, more application based definition of AI: any rule-based application that simulates human intelligence. Rule-based activities possess a very limited ability to learn, opting instead to simply execute a predetermined routine given the same input. The easy Pong AI will always execute the rule provided⁠—to follow the ball – and no matter how long it plays it will only be able to play at an easy level. Clippy will always show up on your screen when it thinks that you are writing a letter, no matter how many letters you write or how annoyed you may get. This outright inability to learn leaves much to be desired to reach the bar of what we would consider human-level intelligence.

Machine Learning: Learning from the Data

This brings us to machine learning. Machine learning is a subset of AI that incorporates math and statistics in such a way that allows the application to learn from data. Machine Learning, then, would be primarily considered a data-driven form of Artificial Intelligence, although rule-driven material can still be applied in concert here where appropriate. Again, the key differentiator is that the algorithms used to build a Machine learning model are not hardcoded to yield any particular output behavior. Rather, Machine Learning models are coded such that they are able to ingest data with labels⁠—e.g. this entry refers to flower A, that entry refers to flower B⁠—and then use statistical methods to find relationships within that data in dimensions higher than would be possible for a human to conceptualize. These discovered relationships are key as they represent the actual ‘learning’ in machine learning. Therefore it is the data, not the code, where the desired intelligence is encoded.

Because of this ability to learn from a set of data, generalized models can be made that do great for certain tasks, instead of needing to hardcode a unique AI for each use-case. Common use cases for Machine Learning models include classification tasks, where a Machine Learning model is asked to separate different examples of data into groups based on some learned features. Examples here are such things like decision trees, which learn and show how best to branch features so that you arrive at a homogenous group (all flower A, or all Churning customer). Another common case for Machine Learning is clustering, where an algorithm is not provided labeled data to train on, but rather is given a massive set of data and asked to find what entries are more alike to one another.

In both of these applications there is not only the opportunity for learning, but continual learning⁠—something that hardcoded, rule-based AI simply cannot do effectively. As more data is collected, there is a growing opportunity to retrain the Machine Learning model and thus yield a more robust form of imitated intelligence. Much of modern business intelligence is built on this style of artificial intelligence given the massive amount of data that businesses now posses.

Limitations of Machine Learning

This is not to say that machine learning is the pinnacle of AI, as there are some severe limitations. The largest limitation to this approach is that we, as humans, must painstakingly craft the datasets used to train machine learning models. While there are many generalized models to choose from, they require labeled data and handcrafted ‘features’—categories of data that are determined to be valuable in the learning process. Many datasets already contain useful data, but in some domains this is much less so. Imagine, for example, you wish to build a machine learning model that can intelligently classify cats from cars. Well, perhaps you pull out the texture of fur and the sheen of cars—but this is a very difficult thing to do, and it is made even harder when one considers that the solution of this model should be general enough to apply to all cats and cars, in any environment or position. Sphynx cats don’t have fur, and some older cars have lost their sheen. Even in simpler, non-image cases, the trouble and time spent constructing these datasets can in some cases cost more than the good they can accomplish.

Crafting these feature-rich, labeled datasets is only one of the limitations. Certain data types, like the case with images we already have described, are simply too dimensionally complex to adequately model with machine learning. Indeed, processing images, audio, and video all suffer from this, a reminder that while these forms of AI are powerful, they are not the ultimate solution to every use case. Indeed, there are other use cases, like natural language processing (NLP) where the goal is to understand unstructured text data as well as a human can, where a machine learning model can be constructed—although it should be acknowledged that there exist more powerful approaches that can more accurately model the contextual relations that exist within spoken language.

Deep Learning: A More Powerful Approach Utilizing Neural Networks

We call this more powerful approach ‘Deep Learning’. Deep Learning is a subset of Machine Learning in that it is data-driven modeling, although Deep Learning also adds the concept of neural networks to the mix. Neural networks sound like science fiction and indeed feature prominently in such work, although the concept of neural networks have been around for quite some time. They were first imagined in the field of psychology in the 1940’s around the hypothesis of neural plasticity, and migrated a time later to the field of computer science in 1948 around Turing’s B-type machines. Research around them stagnated, however, due to conceptual gaps and a lack of powerful hardware.

Modern forms of these networks, having bridged those conceptual and hardware gaps, are able to take on the insane level of dimensionality that data-driven tasks demand by simulating, at a naive level, the network-like structure of neurons within a living brain. Inside these artificial networks are hundreds of small nodes that can take in and process a discrete amount of the total data provided, and then pass its output of that interaction onto another layer of neurons. With each successive layer, the connections of the network begin to more accurately model the inherent variability present in the dataset, and thus are able to deliver huge improvements in areas of study previously thought to be beyond the ability of data modeling. With such amazing ability and such a long history, it is important to reiterate that neural networks, and thus Deep Learning, have only become relevant recently due to the availability of cheap, high volume computational power required and the bridging of conceptual gaps.

When people are talking about AI, it is Deep Learning and its derivatives that are at the heart of the most exciting and smartest products. Deep Learning takes the best from Machine Learning and builds upon it, keeping useful abilities like continual learning and data-based modeling to generalize for hundreds of use cases, while adding support for new use cases like image and video classification, or novel data generation. A huge benefit from this impressive ability to learn high dimensional relationships is that we, as humans, do not need to spend hours painstakingly crafting unique features for a machine to digest. Instead of creating custom scripts to extract the presence of fur of a cat, or a shine on a car, we simply provide the Deep Learning models the images of each class we wish to classify. From there, the artificial neurons begin to process the image and learn for itself the features most important to classify the training data. This alone frees up hundreds if not thousands of hours of development and resource time for complex tasks like image and video classification, and yields significantly more accurate results (than other AI approaches).

One of the more exciting possibilities that Deep Learning brings is the capability to learn the gradients of variability in a given dataset. This provides the unique ability to sample along that newly learned function to pull out a new, never-before-seen datapoint that matches the context of the original dataset. NVidia has done some amazing work that demonstrates this, as seen below, using a type of Deep Learning called Generative Adversarial Networks (GANs) which when provided thousands of images of human faces can then sample against the learned feature distribution and by doing so pull out a new human face, one that does not exist in reality, to a startling level of canniness.

Deep Learning Limitations

Like its complexity-predecesor Machine Learning, Deep Learning has its share of drawbacks. For one, Deep Learning yields results in an opaque way due to its methodology, an attribute known as ‘black box modeling’. In other words, the explainability of the model and why it classifies data as it does is not readily apparent. The same functionality that allows Deep Learning so much control in determining its own features is the same functionality that obscures what the model determines as ‘important’. This means that we cannot say why a general Deep Learning model classifies an image as a cat instead of a car—all we can say is that there must be some statistical commonalities within the training set of cats that differs significantly enough from that of the car dataset—and while that is a lot of words, it unfortunately does not give us a lot of actionable information. We cannot say, for example, that because an individual makes above a certain amount of money that they become more likely to repay a loan. This is where Machine Learning techniques, although more limited in their scope, outshine their more conceptually and computationally complex siblings as ML models can and typically do contain this level of information. Especially as DL models become more depended on in fields like self-driving vehicles, this ability to explain decisions will become critical to garner trust in these Artificial Intelligences.

Another large drawback to Deep Learning is the sheer size of the computational workload that it commands. Because these models simulate, even at only a basic degree, the connections present in a human brain, the volume of calculations to propagate information through that network in a time scale that is feasible requires special hardware to complete. This hardware, in the form of Graphics Processing Units (GPUs), are a huge resource cost for any up-and-coming organization digging into Deep Learning. The power of Deep Learning to learn its own features may offset the initial capital expenditure for the required hardware, but even then it is the technical expertise required to integrate GPUs into any technology stack that is still more often than not the true pain point in the whole acquisition, and can be the straw that breaks the camel’s back. Even with such a large prerequisite, the power and flexibility of Deep Learning for a well-structured problem cannot be denied.

Looking Forward

As the technology continues to grow, so too will the organizing ontology we submit today. One such example will be with the rise of what is known as reinforcement learning, a subset of Deep Learning and AI (specific) that learns not necessarily from data alone, but from a combination of data and some well-defined environment. Such technologies take the best of data-driven and rule-driven modeling to become self-training, enabling cheaper data annotation due to a reduction in initial training data required. With these improvements and discoveries, it quickly becomes difficult to predict too far into the future for what may be mainstream next.

The outline of Artificial Intelligence, Machine Learning, and Deep Learning presented here will remain relevant for some time to come. With a larger volume of data every day, and the velocity of data creation increasing with mass adoption of sensors and the mainstream support of the Internet of Things, data-driven modeling will continue to be a requirement for businesses that wish to remain relevant, and important for consumers to be aware of how all this data is actually being used. All of this in the goal of de-mystifying AI, and pulling back the curtain on these models that have drummed up so much public trepidation. Now that the curtain has been pulled back on the fascinating forms of AI available, we can only hope that the magic of mystery has been replaced with the magic of opportunity. Each of AI, ML, and DL has a place in any organization that has the data and problem statements to chew through it, and in return for the effort, unparalleled opportunity to grow and better tailor themselves for their given customer base.

Special thanks to Tyler Danner for compiling this overview. 


Aunsight End-to-End Data Platform

Understanding Analytics Part 2: Top External Sources of Big Data

Big data analysis is one of the most powerful strategies today’s corporations have in their repertoire. Gathering and analyzing relevant information to better understand trends and glean other insights can offer a nearly endless number of benefits for companies as they look to offer better customer services and enhance their own internal processes.

Before that analysis can result in impactful insights, though, a company must first collect the information they’ll leverage as part of the initiative. Different datasets will provide different results, and there are a range of sources where these details can come from.

In the first part of this series, we examined a few of the top internal sources of data, including transactional information, CRM details, business applications and other company-owned assets. These sources are already under the business’s control, and are therefore some of the first places data scientists look as part of their information gathering efforts.

Sometimes, however, this data isn’t enough. Whether the organization is seeking to answer broader questions about the industry, or better understand potential customers, these initiatives may require the analytics team to look outside the company’s own data sources.

When this takes place, it’s critical that the enterprise understands the most valuable places to gather data that will best benefit its current processes. Today, we’ll take a look at the top sources of external data, including public information that isn’t owned by the company.

Social media: Connecting with your customers

One of the most robust external big data sources is social media channels, including Facebook, Instagram and Twitter. These sites have become incredibly popular – not only for individual customers, but for corporations as well. Through social media profiles, businesses can put an ear to the ground, so to speak, and get a better understanding of their current and potential customers.

And with so many users flocking to these platforms, the potential for big data is significant:

  • Facebook had more than 1.5 billion active users as of April, 2016.
  • Twitter had 320 million active users in the first quarter of this year.
  • Instagram had 400 million active users in early 2016.
  • Other platforms aren’t far behind: Snapchat boasts more than 200 million users, Pinterest and LinkedIn were tied at 100 million active users.

In addition, helpful sources like Facebook Graph help companies make the best use of this information, aggregating a range of details that users share on the platform each day.

“Social media data can be incredibly telling.”

Overall, social media data can be incredibly telling, offering insights into both positive and negative brand feedback, as well as trends, activity patterns and customer preferences. For instance, if a company notices that a large number of social media users are seeking a specific type of product, the business can move to corner the market and address these needs – all thanks to social media big data insights.

Public government data

While social media information is no doubt powerful, this isn’t the only external data source companies should pay attention to. The federal government also provides several helpful informational sources that help today’s enterprises get a better picture of the public. According to SmartData Collective, few of the best places to look here include:

  • Data.gov: This site was recently set up by federal authorities as part of the U.S. government’s promise to make as much data as possible available. Best of all, these details are free, and accessible online. Here, companies will find a wealth of data, including information related to consumers, agriculture, education, manufacturing, public safety and much more.
  • Data.gov.uk: Businesses looking for a more global picture can look to this site, where the U.K. government has amassed an incredible amount of metadata dating back to 1950.
  • The U.S. Census Bureau: The Census Bureau has also made a range of data available online, covering areas such as overall population, geographical information and details related to regional education.
  • CIA World Factbook: The Central Intelligence Agency no doubt has huge repositories of information at its disposal, and has made select information available via its online Factbook. This resource provides data on global population, government, military, infrastructure, economy and history. Best of all, it covers not only the U.S., but 266 other countries as well.
  • Healthdata.gov: Health care information can also be incredibly powerful for companies in that industry, as well as those operation in other sectors. This site provides more than 100 years of U.S. health care information, including datasets about Medicare, population statistics and epidemiology.

Google: The data king

Google has also provided a few key, publicly available data sources. As one of the biggest search engines in the world, Google has a wealth of information about search terms, trends and other online activity. Google Trends is one of the best sources here, providing statistical information on search volumes for nearly any term – and these datasets stretch back to nearly the dawn of the internet.

Other powerful sources provided by Google including Google Finance, which includes 40 years of stock market data that is continually updated in real time. In addition, Google Books Ngrams allows companies to search and analyze the text of millions of books Google has in its repository.

The right data: Answering the big questions

Overall, in order for businesses to answer the big questions guiding their initiatives, they must have access to the right data. Public, external sources can help significantly, as can a partnership with an expert in the big data field.

Aunalytics can not only help today’s enterprises gather and analyze their available information, but can also help fill any gaps that might hold back the success of an initiative. Our scalable big data solutions ensure that your organization has everything it needs to reach the valuable insights that will make all the difference.


Aunsight End-to-End Data Platform

Understanding Analytics Part 1: Top Internal Sources of Big Data

There’s no arguing the power of big data in today’s corporate landscape. Businesses are analyzing a seemingly endless array of data sources in order to glean insights into just about every activity – both inside their business, as well as those that are customer-facing. Right now, it seems that enterprises cannot get their hands on enough big data for analysis purposes – the opportunities and advantages to be had here are tempting, as well as actionable, and can really make all the difference for today’s companies.

However, as corporations’ hunger for data grows, so too does their search for usable data sources. There are several places where businesses can gather and collect big data, both inside and outside of their own organizations. Currently, there are a more than a few data brokers that will sell lists of information – and while these may seem helpful, it’s up to the enterprise to analyze and make the best use of this data.

What’s more, without the proper knowledge, skills and support, these lists can be incredibly ineffective and, therefore, not worth the investment. Before businesses turn to data brokers, there are a few key places that they can look to gather their own big data. Let’s take a look at some of the top informational sources, and how these can benefit your organization, no matter what industry you operate in.

Internal vs. external

Before we get into the specific sources themselves, it’s important to understand the main classification of these datasets. Overall, there are two main categories that big data can fall under: internal or external.

“Internal sources of data reflect those data that are under the control of the business,” Customer Think contributor and data scientist Bob Hayes explained. “External data, on the other hand, are any data generated outside the wall of the business.”

In this way, internal data is the information that the business already has on hand, has control of and currently owns, including details contained within the company’s own computer systems and cloud environments. External data is information that is not currently owned by the company, and can include unstructured, public data as well as information gathered by other organizations.

Today, we’ll take a deep dive into internal data sources, including those that are currently controlled by the organization under its own roof.

Internal data: Company-owned information systems

Before decision-makers and data scientists look for external sources, it’s critical to ensure that all of a business’s internal data sources are mined, analyzed and leveraged for the good of the company. While external data can offer a range of benefits that we’ll get into later, internal data sources are typically easier to collect and can be more relevant for the company’s own purposes and insights.

There are a number of impactful, internal places that companies can look to mine data. These include:

  • Transactional data and POS information: One of the most powerful sources of data resides within a firm’s financial and transactional systems. Here, companies can mine both current and historical data relating to their own business purchases, as well as information relating to the shopping trends of their customers. From these details, an organization can glean important insights, including ways to reduce their own spending and remain on budget, as well as crucial patterns pertaining to their customers’ buying habits and shopping preferences.
  • Customer relationship management system: In addition to their purchasing and shopping data, businesses can also mine data within their own CRM systems. Information like clients’ company affiliations, locations and other regional or geographical details can paint a detailed picture about where customers are located. When combined with their transactional information, these CRM details become even more powerful.
  • Internal documents: Especially now within the age of cloud computing, a company’s own internal documents are becoming more valuable than ever. Digitized copies of internal forms can provide a robust source of information, particularly when it comes to the business’s activities, policies and processes. Kapow Software noted in an infographic that emails, Word documents, PDF, XML and a range of other internal docs can be mined for big data.
  • Archives: When it comes to internal information, businesses shouldn’t limit themselves to only the most current information. Historical data can be very telling as well, which is why Kapow Software recommends looking into the company’s archived documents and data streams as well.
  • Other business applications: While CRM is one of the most robust internal sources of big data, this doesn’t mean that other internal applications cannot be mined. Other platforms that employee users leverage, including project management, marketing, productivity, enterprise resource management, human resources, expense management as well as automation apps can be incredibly beneficial as well. When mining these sources, it’s in a company’s best interest to let the nature of their big data initiative drive their decisions surrounding which sources to utilize. For example, if an organization is looking to gain insight about the current budget, sources like expense tracking and resource management will be the most helpful.
  • Device sensors: The Internet of Things is growing every day, and providing additional and increasingly unique data for analysis. Companies that utilize devices that are equipped with sensors and network connectivity can leverage these for data as well. These include IoT items that the business uses in its own office, or those that it provides for its customers. For instance, car sensors on an enterprise’s fleet of vehicles can offer a wealth of data about usage, mileage, gas and traveling expenses. Companies that offer fitness or other health sensors can gather, anonymize and analyze these sources as well.

“Internal data sources are typically easier to collect and can be more relevant.”

Internal big data: Answering the big questions

Overall, internal sources of big data can offer numerous advantages for today’s businesses. Not only are these sources incredibly telling and relevant, but they’re free of cost to the company, as this is information that the organization already owns. In this way, enterprises can launch an array of big data initiatives without ever looking beyond their own walls.

However, when it comes to analyzing these sources, it’s best to have an industry-leading partner like Aunalytics that can help your firm answer the big questions. Aunalytics specializes in big data analysis, and can help pinpoint the source that will provide the most valuable and competitive advantage for your company. To find out more, contact Aunalytics today.

And check out the second part of this series, where we investigate the top external sources of big data, and how these can be best utilized.


What Can Clickstream Data Tell You About Your business?

Today, more businesses leverage big data to inform important decisions than ever before. This information can come from a range of different sources, each of which paints an insightful new picture of the company, its customers or both. However, in order to reap these benefits, organizations must not only have the data itself, but the skills and understanding to analyze and apply it in the best way possible.

One of the most revealing sources here is clickstream data, which can offer numerous advantages for businesses.

What, exactly, is clickstream data?

Before we get into the actual application of clickstream data, it's important to understand what this information is and where it comes from.

Clickstream data can be thought of as a roadmap of a user's online activity. This information represents digital breadcrumbs that show what websites a user has visited, what pages they viewed on that site, how long they spent on each page and where they clicked next.

"A clickstream is the recording of what a user clicks while browsing the web," Mashable explained. "Every time he or she clicks on a link, an image, or another object on the page, that information is recorded and stored. You can find out the habits of one individual, but more useful is when you record thousands of clickstreams and see the habits and tendencies of your users."

Clickstreams can be stored on the server that supports a website, as well as by a user's own web browser. In addition, internet service providers and online advertising networks also have the capability to record and store clickstream information.

What's included in clickstream information?

Diving a little deeper here, there are a range of insights clickstream data can offer, starting at the beginning of a user's journey.

For instance, clickstream information can show what terms an individual plugged into a search engine in order to reach the company's page. These details can reveal any other websites the user might have visited before reaching the business's website. Once the visitor has reached the site, clickstream data can show what page the person first landed on, what features or capabilities he or she clicked on once there, how much time was spent on that page and where the online journey took him or her after that page.

But clickstream data doesn't end there. In addition to revealing which pages a user visited and in what order, this information can also show any use of the "back" button, as well as when and where items were added or removed from a shopping cart.

While clickstreams do not include personal details of the users themselves, when collected and analyzed, this information can be applied to numerous improvements to the company's website and overall online presence.

Applying clickstream analysis: How can my business benefit?

There are several ways businesses can make use of clickstream analysis, including to enhance the experience users have with the brand. Let's take a look:

1. Identifying customer trends: Thanks to clickstream information, companies can see the path customers have taken in order to get to their site. By collecting and analyzing the clickstreams of a large number of customers, an enterprise can identify certain similarities and trends that they can leverage to the organization's advantage. For instance, if a majority of users utilized the same search term to reach a site that led them to the brand's website, the company can eliminate the middle man and ensure that their site is optimized for that search term.

2. Different pathways lead to the same destination: Clickstream data can also be leveraged to view the different routes customers might have taken to reach a product page.

"Just as drivers can take different roads to arrive at the same destination, customers take different paths online and end up buying the same product," Qubole noted. "Basket analysis helps marketers discover what interests customers have in common, and the common paths they took to arrive at a specific purchase."

Using these details, the company can look to create the most efficient path possible for customers, ensuring that they quickly and effectively locate the product they're looking for and can easily complete their purchase.

3. Preventing abandonment: In addition to "cart abandonment," analyzing the positive website interactions, clickstream data can also reveal the top pages where the most visitors leave the site. For instance, if a large number of users exit the site on a certain page, it could be very telling about the page itself. It could be that a feature on that page isn't working as it should, or the website is asking users for information that they aren't ready to give at that juncture. Whatever the reason, clickstream can show which pages on a site may need extra attention and improvement.

Best of all, this is only the beginning when it comes to clickstream data. These details can reveal even more when they belong to registered users - here, demographic information is made available, enabling the company to create targeted ads and other, more personalized offers.

Clickstream data can be incredibly powerful for today's companies, but only if firms have the skills and resources necessary to capture, collect and analyze this information. Aunalytics is a top expert in this field, providing the technology necessary to support clickstream analysis. To find out more about how this process can benefit your business's unique needs, contact the experts at Aunalytics today.


Customer Intelligence

The Internet of Things: Challenges, Insights, & The Future

This month, we sat down with Aunalytics’ Vice President of Predictive Modeling, David Cieslak, PhD, to discuss his work on Internet of Things (IoT) analysis. We talked about the unique challenges of this type of project and what he’s learned, interesting insights he has discovered, and his thoughts on the future of the IoT field.

Q: How does an IoT project differ from other kinds of machine learning problems you have faced, and how are they similar? Are there differences within the data itself? Do you tend to use different methods of analysis

DC: It is exciting for Aunalytics to engage in the Internet of Things. A data scientist or machine learning researcher is especially captivated by this kind of problem for a variety of reasons. Beyond working on a high profile, cutting-edge area that brings a lot of hype and excitement, IoT data is very rich. Like responsibly collected web traffic utilized in clickstream analysis, a data scientist can walk into an IoT project with reasonable assumptions for high levels of data capture and information quality as data is being collected via autonomous, digital sensors. Such sensors do a good job of collecting a variety of data points pertaining to device operation, location, and user interaction. These values are often logically and consistently encoded; in some cases they are tailor-made with analytics or data science in mind. The implication is that a data scientist can often assume a higher starting point.

While the overall signal quality often presents a better opportunity, such a challenge can put a data scientist’s quantitative skills and creativity to the test. Algorithmically, data scientists might be asked to get out of their comfort zone and utilize advanced signal processing methods in order to provide digestible information. Likewise, time series analysis and anomaly detection feature more heavily in the IoT domain. Whereas hand-crafted featurization was often sufficient for other types of projects, IoT almost necessitates advanced, automated quantization strategies in order to keep up with the pace of data and business. The rules of the IoT game are being written in-flight and it’s critical for a data scientist to be able to learn and adapt to what works and what doesn’t, particularly within this domain. This requires the ability to understand contributions from many different engineering and mathematical disciplines and leveraging prior work from a variety of sources while simultaneously boiling down complexity without making the subject matter overly simplistic.

Q: What specific challenges have you faced in terms of analysis of device data? What lessons have you learned so far?

DC: The biggest issue surrounding IoT data is scale. Historically, a “more is better” approach has been taken with regards to logging, but this can have very practical implications on analysis. Sensors on an IoT enabled device might generate a status snapshot every second or even more frequently. Even a single record generated every second means that you’ll be responsible for storing and processing 86,400 records of data per device every day. If you have a fleet of 10 devices generating 10 pieces of data in every snapshot, it’s easy to imagine how quickly 8.6 million daily records can begin to saturate even the bulkiest big data solutions available. Whereas data scientists have typically been begging for more data, it’s very easy to see how they might drown in this environment. One very real decision that must be made is to determine what data is collected and how often and whether any sampling must be done in order to accommodate analysis. As always, this depends on the application and the availability of data processing resources. Sampling fridge sensors every 5 minutes might lead to a miss in temperature spikes that cause your $50 Ahi steak to go bad. Sampling a subset of vehicle dynamics every 5 minutes might miss a rapidly evolving failure and lead to a fatal accident.

Relatedly, it can be very challenging to boil down a lot of data to the audience. While this is a pervasive challenge in data science, the temporal nature of the signals we’re receiving mean that it’s even more challenging for a data scientist to translate a relevant, high-level inquiry into something structured and measurable. This puts a lot of responsibility on a data scientist to have a sufficiently broad and workable “statistical vocabulary” to satisfy highly curious audiences.

Q: What kinds of “insights” have you been able to uncover with clients?

DC: So far, we’ve looked at IoT through a lens of consumer products. This focus has led us to uncover interesting utilization patterns. Our customers have invested heavily into engineering product features development but what we find is that in many instances customers lock into a small subset and use them habitually. The good news is that the utilized features are often fairly unique per customer, so few features are truly going to waste. This also represents an opportunity for our clients to develop outreach programs for better product education.

While product and engineering research is important, this can also translate into savings for the customer as well. Depending on where they live, they might be able to save money on their electrical bill by using appliances at specific points in the day. Likewise, business experts may be able to help clients use their devices in ways to save them money.

We’re also identifying frustration events in the data, typically where we’re observing “jamming patterns” where particular buttons are pressed obsessively over a short period of time. Likewise, we’re working to identify how sensory signals can be utilized to predict device failure, enabling a potentially interventionist strategy.

Q: What do you see as some of the most exciting developments in IoT so far?

DC: Overall, I’m excited to see many consumer durables and home goods entering the IoT breech. There are many gains to be made from power and environmental savings as well as safety by having such appliances monitored.

IoT has significant potential in fitness and health. EMR systems are largely incidence based—they track information when a patient has a problem, but fitness devices offer an opportunity for broadening an otherwise sparse dataset by quantifying fitness before a health incidence occurs.

There are significant opportunities for IoT within critical infrastructure pieces for our country and the world. Public transportation such as trains and planes stand to benefit from superior safety monitoring. Better monitoring can lead to alterations in operating policies which can also lead to better energy efficiencies. There are tremendous benefits within agriculture as well—farmers can now do a better job of tracking their crop “in flight,” meaning critical growth is at reduced risk for failure. These are only some of the ways that IoT technologies are being applied today.

Q: Where do you see this field going in the future?

DC: IoT is also a useful testbed for a broad class of robotics. Never before have we been able to collect so much data on behavior and activities at such a micro-level. Many of the biggest informatic developments of the last 20 years have been bootstrapped by creating data collection and tagging schemas, such as video and audio signal processing. In turn, collecting such voluminous data will enable robotics research to develop even better understandings of human interactions and activity, and allow them to make significant gains in this area over the next 20 years. Another rising area is Population Health, where we will develop better understandings of the influx of patients into particular healthcare facilities and practices.


Building a Data Warehouse

To perform interesting predictive or historical analysis of ever-increasing amounts of data, you first have to make it small. In our business, we frequently create new, customized datasets from customer source data in order to perform such analysis. The data may already be aggregated, or we may be looking at data across disparate data sources. Much time and effort is spent preparing this data for any specific use case, and every time new data is introduced or updated, we must build a cleaned and linked dataset again.

To streamline the data preparation process, we’ve begun to create data warehouses as an intermediary step; this ensures that the data is aggregated into a singular location and exists in a consistent format. After the data warehouse is built, it is much easier for our data scientists to create customized datasets for analysis, and the data is in a format that less-technical business analysts can query and explore.

Data warehouses are not a new concept. In our last blog post, we talked about the many reasons why a data warehouse is a beneficial method for storing data to be used for analytics. In short, a data warehouse can improve the efficiency of our process by creating a structure for aggregated data and allows data scientists and analysts to more quickly get the specific data they need for any analytical query.

A data warehouse is defined by its structure and follows these four guiding principles:

  1. Subject-oriented: The structure of a data warehouse is centered around a specific subject of interest, rather than as a listing of transactions organized by timestamps.
  2. Integrated: In a data warehouse, data from multiple sources is integrated into a single structure and consistent format.
  3. Non-volatile: A data warehouse is a stable system; it is not constantly changing.
  4. Time-variant: The term “time-variant” refers to the inclusion of historical data for analysis of change over time.

These principles underlie the data warehouse philosophy, but how does a data warehouse work in practice? We will explore two of the more concrete aspects of a data warehouse: how the data is brought into the warehouse, and how the data may be structured once inside.

Data Flow into a Warehouse

Most companies have data in various operational systems; marketing databases, sales databases, and even external data purchased from vendors. They may even have a data warehouse of their own for certain areas of their business. Unfortunately, it is next to impossible to directly compare data across various locations. In order to do such analysis, a great amount of effort is needed to get the data onto a common platform and into a consistent format.


First, these disparate data sources must be combined into a common location. The data is initially brought to an area known as the integration layer. Within the integration layer, there is an ODS (operational data store) and a staging area, which work together (or independently at times) to hold, transform, and perform calculations on data prior to the data being added to the data warehouse layer. This is where the data is organized and put into a consistent format.

Once the data is loaded into the data warehouse (the structure of which we will discuss later on in the blog post), it can be accessed by users through a data mart. A data mart is a subset of the data that is specific to individual department or users and includes only the data that is most relevant to their specific use cases. There can be multiple data marts, but they all pull from the same data warehouse to ensure that the information that is seen is the most up-to-date and accurate. Many times, in addition to marts, a data warehouse will have databases specially purposed for exploration and mining. A data scientist can explore the data in the warehouse this way, and generate custom datasets on an analysis-by-analysis basis.

At every step of the way, moving the data from one database to another involves using a series of operations known as ETL, which stands for extract, transform, and load. First, the data must be extracted from the original source. Next, that data is transformed into a consistent format, and finally, the data is loaded into the target database. These actions are performed in every step of the process.

Data Warehouse Structure

There are a few different ways that the data within the warehouse can be structured. A common way to organize the data is to use what is called a star schema. A star schema is composed of two types of tables: fact tables and dimension tables.

Fact tables contain data that corresponds to a particular business practice or event. This would include transaction details, customer service requests, or product returns, to name a few. The grain is the term for the level of detail of the fact table. For instance, if your fact table recorded transaction details, does each row include the detail of the transaction as a whole, or each individual item that was purchased? The latter would have a more detailed grain.

While fact tables include information on specific actions, a dimension table, on the other hand, includes non-transactional information that relates to the fact table. These are the items of interest in analytics: data on each individual customer, location/branch, employee, product, etc. In other words, the dimension is the lens through which you can examine and analyze the fact data.

There are typically far fewer facts, which are “linked” to the various dimension tables, forming a structure that resembles a star, hence the term star schema.


Star Schema

A snowflake schema is similar to the star schema. The main difference is that in a snowflake schema, the dimension tables are normalized--that means that the individual dimension tables from the star schema are re-organized into a series of smaller, sub-dimension tables which reduces data redundancy. This is done so that the same information isn’t stored in multiple tables, which makes it easier to change or update the information since it only has to be change in one location. The downside of the snowflake schema is that it can be complicated for users to understand, and requires more code to generate a report. Sometimes it is best to maintain a de-normalized star schema for simplicity’s sake.

Conclusion

These are just the basics of how data flows into a data warehouse, and how a warehouse could be structured. While the star and snowflake schemas are not the only way (there is also a newer schema called a Data Vault), they do provide a standardized way to store and interact with historical data. Ultimately, a well-organized data warehouse allows data scientists and analysts to more easily explore data, ask more questions, and find the answers they need in a more timely fashion.