Credit Unions Realize Business Outcomes Sooner by Utilizing Aunalytics' Expertise
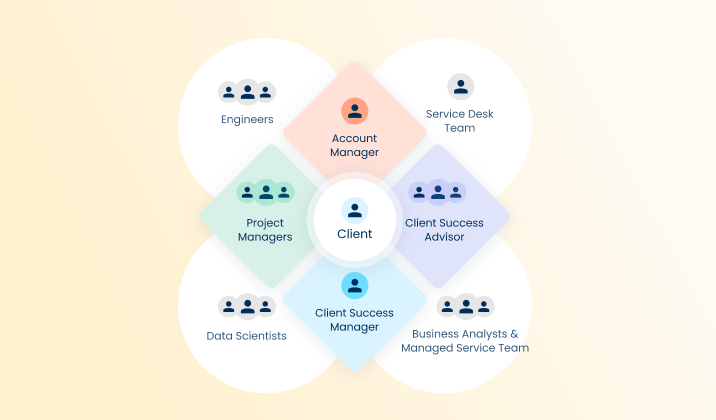
Aunalytics speeds time to value for credit unions looking to dive into analytics. By offering a well-rounded team including technology experts—such as data engineers and data scientists—and subject matter experts with experience in the financial services industry, Aunalytics is able to implement our Daybreak solution quickly and get credit unions actionable business answers using machine learning and AI.
Watch the video below to learn more about how our team gets credit unions the answers they need faster.
Data Scientists: Take Data Wrangling and Prep Out of Your Job Description
It is a well-known industry problem that data scientists typically spend at least 80% of their time finding and prepping data instead of analyzing it. The IBM study that originally published this statistic dates to even before most organizations adopted separate best-of-breed applications in functional business units. Typically, there is not one central data source used by the entire company, but instead there exist multiple data silos throughout an organization due to decentralized purchasing and adoption of applications best suited for a particular use or business function. This means that now data scientists must cobble together data from multiple sources, often having separate “owners,” wrangle IT and the various data owners to extract and get the data to their analytics, and then make it usable. Having Data Analysts and Data Scientists work on building data pipelines is not only a complex technical problem but also a complex political problem.
To visualize analytics results, a data analyst is not expected to build a new dashboard application. Instead, Tableau, Power BI and other out-of-the-box solutions are used. So why require a data analyst to build data pipelines instead of using an out-of-the-box solution that can build, integrate, and wrangle pipelines of data in a matter of minutes? Because it saves time, money, and angst to:
- Automate data pipeline building and wrangling for analytics-ready data to be delivered to the analysts;
- Automatically create a real-time stream of integrated, munched and cleansed data, and feed it into analytics in order to have current and trusted data available for immediate decision-making;
- Have automated data profiling to give analysts insights about metadata, outliers, and ranges and automatically detect data quality issues;
- Have built-in data governance and lineage so that a single piece of data can be tracked to its source; and
- Automatically detect when changes are made to source data and update the analytics without blowing up algorithms.
Building data pipelines is not the best use of a data scientist’s time. Data scientists instead need to spend their highly compensated time developing models, examining statistical results, comparing models, checking interpretations, and iterating on the models. This is particularly important given that there exists a labor shortage of these highly skilled workers in both North America and Europe and adding more FTEs into the cost of analytics projects makes them harder for management to justify.
According to David Cieslak, Ph.D., Chief Data Scientist at Aunalytics, without investment in automation and data democratization, the rate at which one can execute on data analytics use cases — and realize the business value — is directly proportionate to the number of data engineers, data scientists, and data analysts hired. Using a data platform with built-in data integration and cleansing to automatically create analytics-ready pipelines of business information allows data scientists to concentrate on creating analytical results. This enables companies to rapidly build insights based upon trusted data and deliver those insights to clients in a fraction of the time that it would take if they had to manually wrangle the data.
Our Solution: Aunsight Golden Record
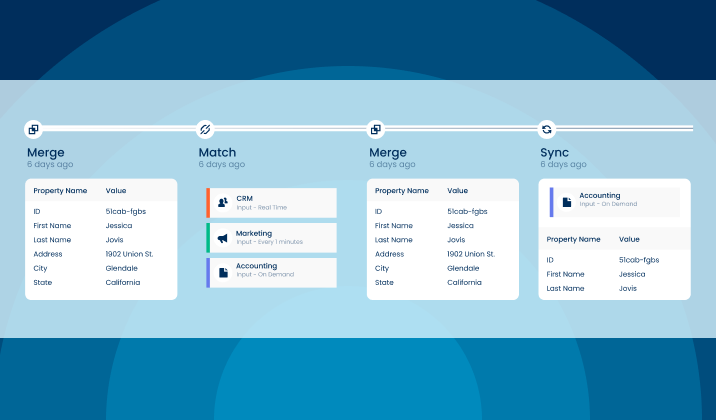
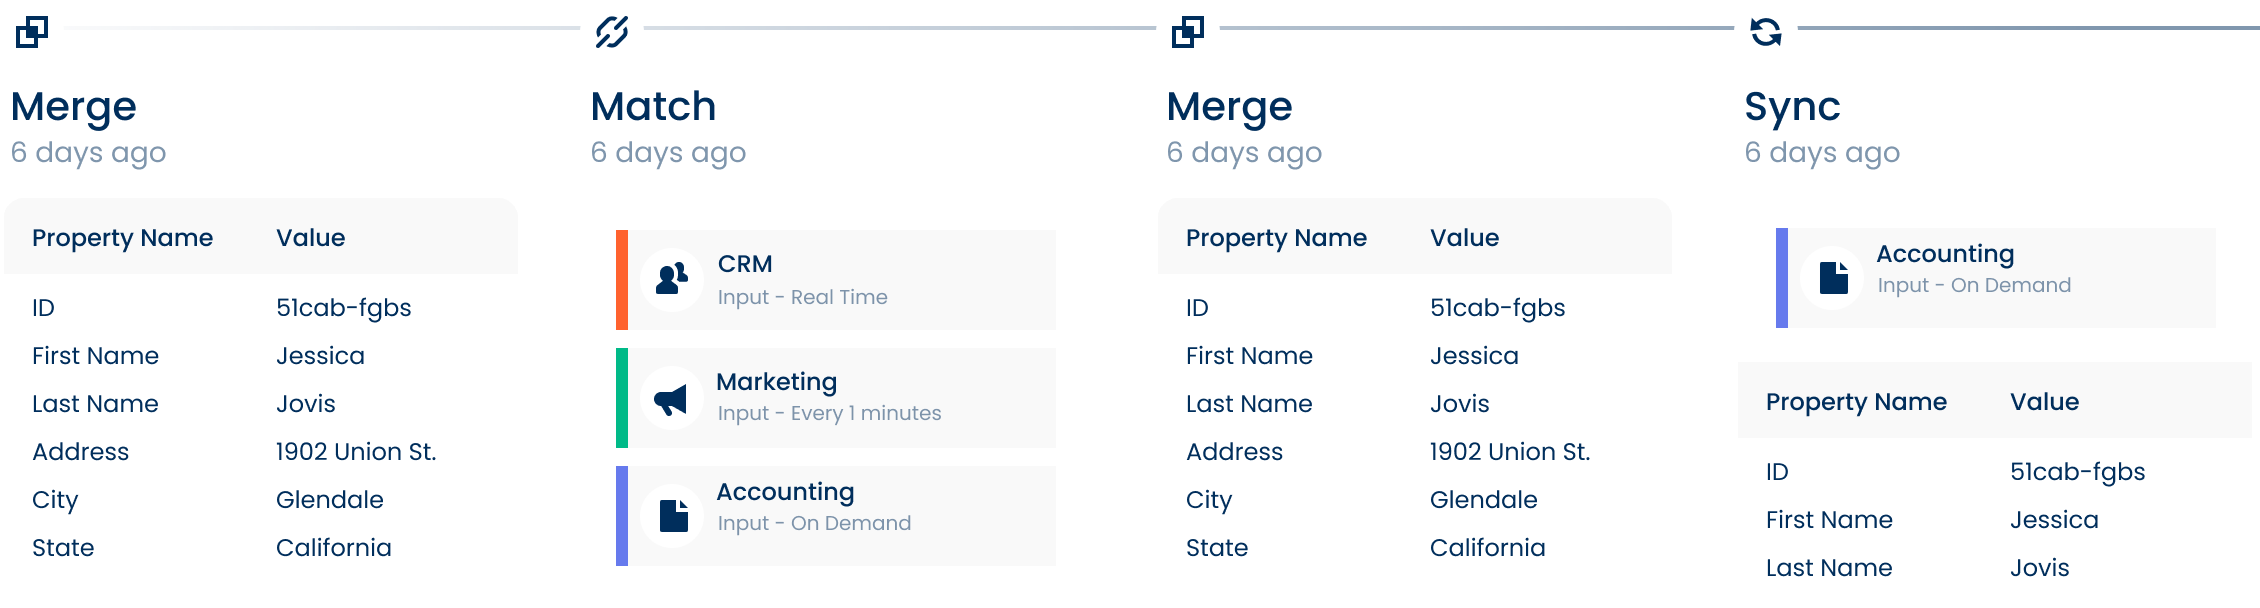
Aunsight™ Golden Record turns siloed data from disparate systems into a single source of truth across your enterprise. Powered with data accuracy, our cloud-native platform cleanses data to reduce errors, and Golden Record as a Service matches and merges data together into a single source of accurate business information – giving you access to consistent trusted data across your organization in real-time. With this self-service offering, unify all your data to ensure enterprise-wide consistency and better decision making.

Meeting the Challenges of Digital Transformation and Data Governance
 The Data Accuracy market (traditionally defined in terms of Data Quality and Master Data Management) is currently undergoing a paradigm shift from complex, monolithic, on-premise solutions to nimble, lightweight, cloud-first solutions. As the production of data accelerates, the costs associated with maintaining bad data will grow exponentially and companies will no longer have the luxury of putting data quality concerns on the shelf to be dealt with “tomorrow.”
To meet these challenges, companies will be tempted to turn to traditional Data Quality (DQ) and Master Data Management (MDM) solutions for help. However, it is now clear that traditional solutions have not made good on the promise of helping organizations achieve their data quality goals. In 2017, the Harvard Business Review reported that only 3 percent of companies’ data currently meets basic data quality standards even though traditional solutions have been on the market for well over a decade.1
The failure of traditional solutions to help organizations meet these challenges is due to at least two factors. First, traditional solutions typically require exorbitant quantities of time, money, and human resources to implement. Traditional installations can take months or years, and often require prolonged interaction with the IT department. Extensive infrastructure changes need to be made and substantial amounts of custom code need to be written just to get the system up and running. As a result, only a small subset of the company’s systems may be selected for participation in the data quality efforts, making it nearly impossible to demonstrate progress against data quality goals.
Second, traditional solutions struggle to interact with big data, which is an exponentially growing source of low-quality data within modern organizations. This is because traditional systems typically require source data to be organized into relational schemas and to be formatted under traditional data types, whereas most big data is either semi-structured or unstructured in format. Furthermore, these solutions can only connect to data at rest, which ensures that they cannot interact with data streaming directly out of IoT devices, edge services or click logs.
Yet, demand for data quality grows. Gartner predicts that by 2023, intercloud and hybrid environments will realign from primarily managing data stores to integration.
Therefore, a new generation of cloud-native Data Accuracy solutions is needed to meet the challenges of digital transformation and modern data governance. These solutions must be capable of ingesting massive quantities of real-time, semi-structured or unstructured data, and be capable of processing that data both in-place and in-motion.2 These solutions must also be easy for companies to install, configure and use, so that ROI can be demonstrated quickly. As such, the Data Accuracy market will be won by vendors who can empower business users with point- and-click installations, best-in-class usability and exceptional scalability, while also enabling companies to capitalize on emerging trends in big data, IoT and machine learning.
1. Tadhg Nagle, Thomas C. Redman, David Sammon (2017). Only 3% of Companies’ Data Meets Basic Data Quality Standards. Retrieved from https://hbr.org/2017/09/only-3-of-companiesdata-meets-basic-quality-standards
2. Michael Ger, Richard Dobson (2018). Digital Transformation and the New Data Quality Imperative. Retrieved from https://2xbbhjxc6wk3v21p62t8n4d4-wpengine.netdna-ssl.com/wpcontent/uploads/2018/08/Digital-Transformation.pdf
What is a Product Propensity Report?
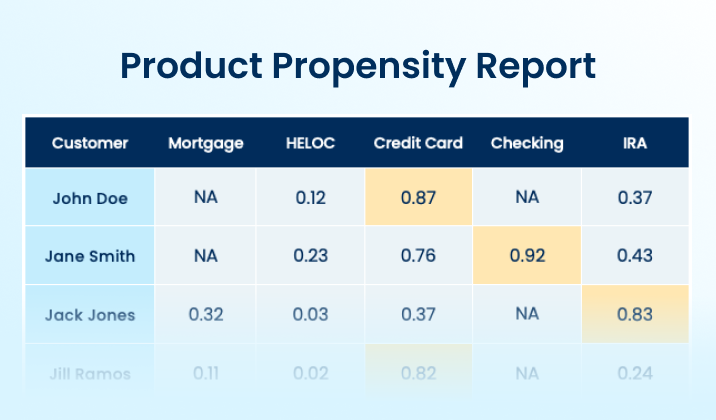
Cultivating a long-term customer relationship requires intelligent marketing efforts based on a solid understanding of the types of products a particular customer or group of customers would most likely be interested in based on their past behavior. Aunalytics has nearly a decade’s worth of experience assisting our clients with data analysis projects and now offers the fruits of that experience as the Product Propensity Report Framework for our Daybreak™ Analytic Database subscribers. The Product Propensity Report Framework (PPRF) provides a customized dataset with an individualized analysis of every customer’s propensity for new financial services products by type. Think of it like a PivotTable in Excel with a row for every customer and columns representing each of the products your institution offers with a propensity score showing the likelihood that customer might opt for that product.
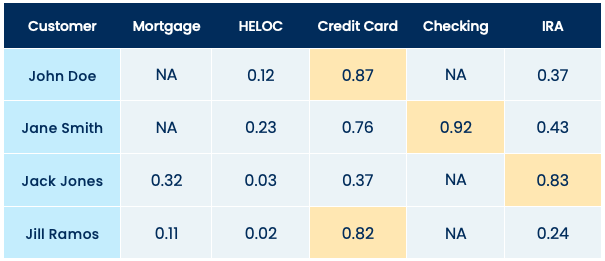
The preceding example is purely illustrative since every Product Propensity Report is customized to the types of products and services offered by our clients, but it shows the general structure of how such a report might look like for a client offering five different products. In this example, customers receive a decimal score (0-1) for each product, or an indication that the customer already has that product (NA). In this example, we can see that Jane Smith is predicted to be very likely to open a checking account or possibly a credit card account, whereas John Doe and Jill Ramos will likely open a credit card account, and Jack Jones will most likely be interested in a retirement account.
Aunalytics generates these Product Propensity Reports for clients based on a machine learning algorithm that learns about new accounts opened from your organization’s historical data. This algorithm digs into data about transactions and current product utilization to construct a model that can identify future customers’ propensities based on patterns in this data. The output of this model is tailored uniquely to your organization’s product offerings and trained on your organization’s data in order to provide you with reporting that gives you a deeper glimpse into what your customers are after and how best to tailor your outreach to connect those customers with the products and services they are most interested in.
Visualize Data-Driven Answers with Daybreak Insights
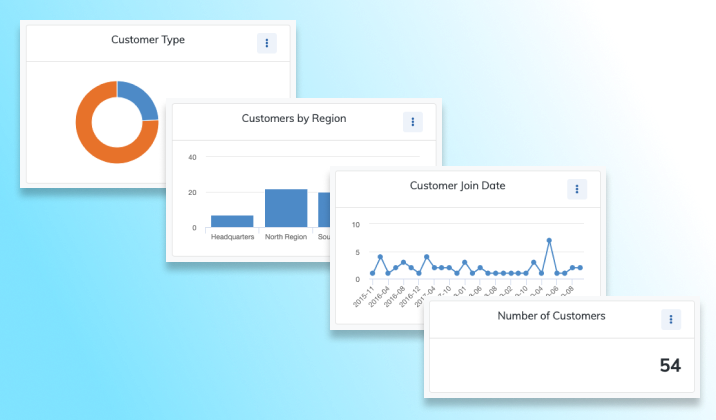
 Daybreak™ Insights provide best-in-industry value for analytics platforms by integrating data visualization to display results of AI and Machine Learning powered analytics assessment of your data. Daybreak exists to enable anyone to get data-driven answers to their questions. With easy-to-use tools like Daybreak Natural Language Answers, users without a background in database technology can generate result sets from their data by simply asking questions about the data. No coding, or technical knowledge of databases, datamarts, SQL queries or how to get your data prepped and ready for analysis is needed. Insights are revealed based upon your data in the form of lists of customer records that match your query and also by visualizations to display those results in various graphical forms like line, donut, or bar charts. This tool provides similar capabilities to dedicated BI tools like Tableau or PowerBI, and is available as part of Daybreak. Daybreak also allows you to export analytic results to your favorite BI visualization tool, where your team may have already built custom views and dashboards.
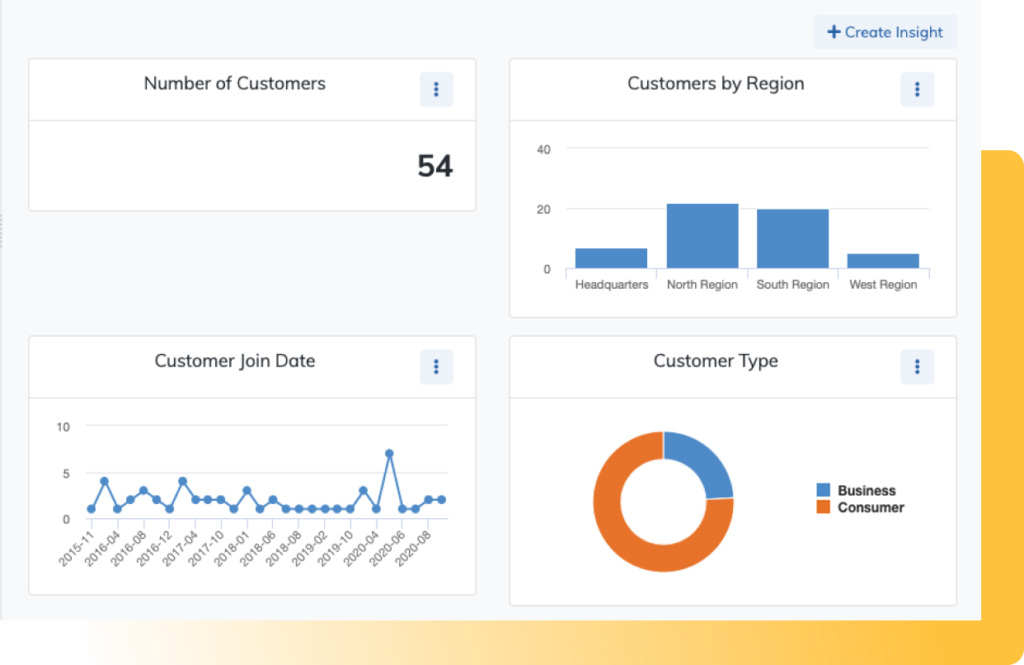
Insights are a valuable way to share stories about data with other members of your organization. The Daybreak Insights dashboard enables you to build a custom dashboard for saved queries, and then share that dashboard with other Daybreak users on your team. Insights can also be saved as downloadable graphics for inclusion in other documents or slideshows to accelerate and automate data-driven presentations.
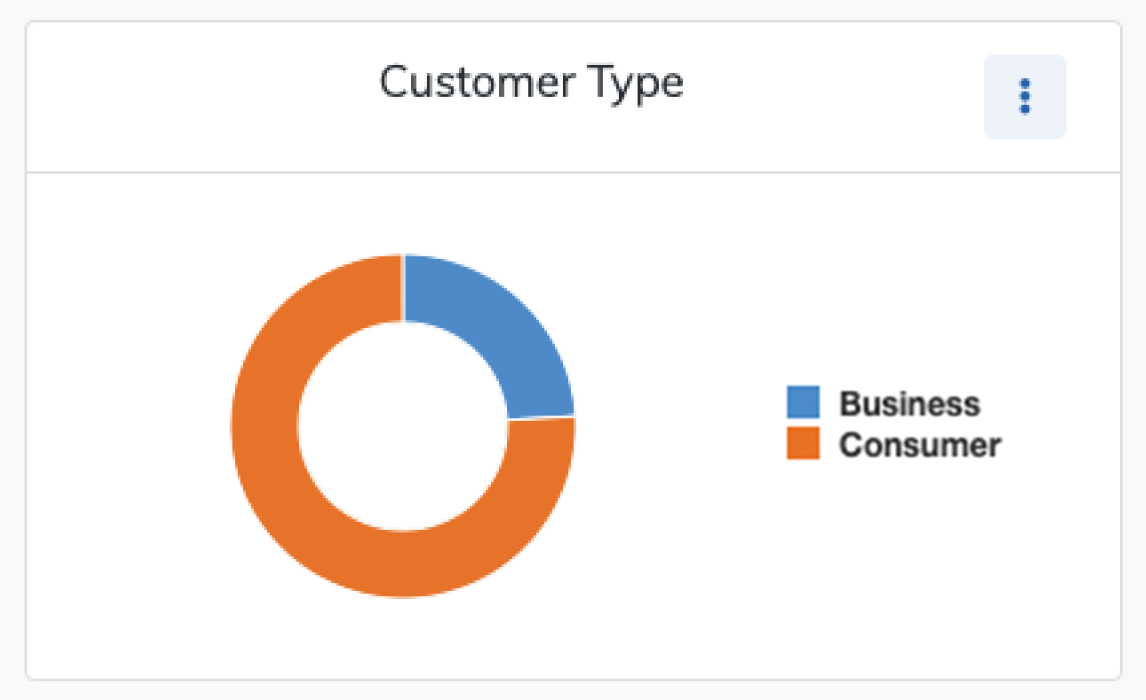
Figure 1: Daybreak Insight showing the proportion of business vs. consumer customers
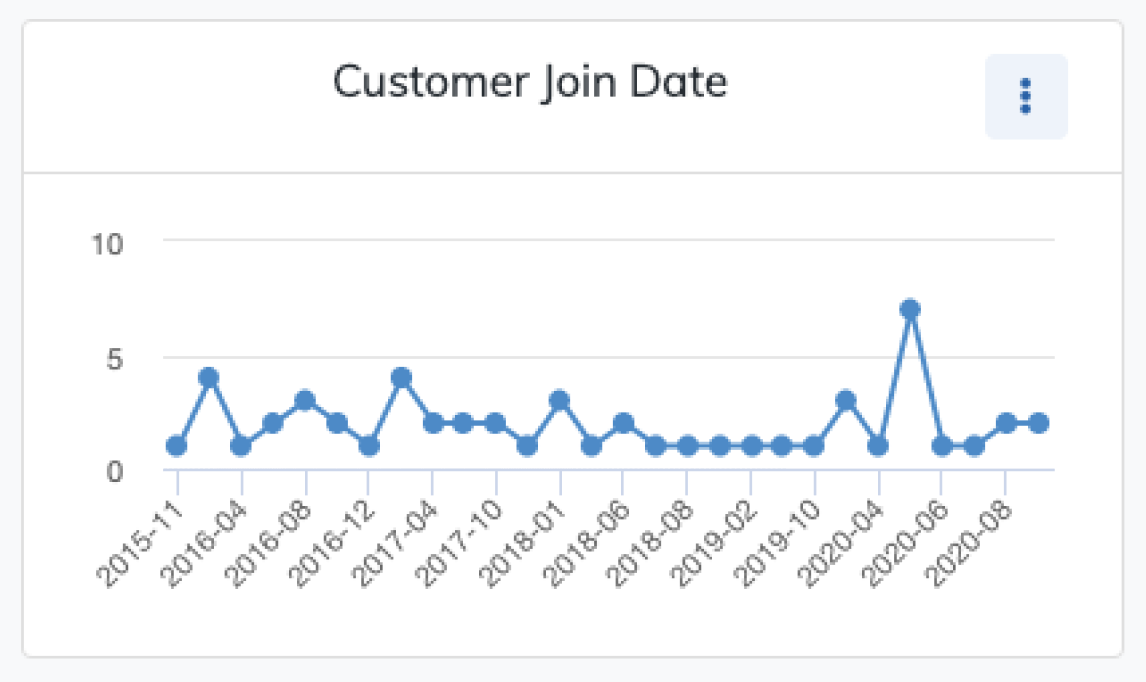
Figure 2: Daybreak Insight showing the number of customers joining over time
Daybreak Insights are easy to create. Simply click the “Insights” tab to add an Insight. Daybreak supports different kinds of charts to display different kinds of data, like timeseries line charts, column or donut charts, or summary metrics to display simple calculations based on fields. Each type of Insight has its own settings that can be configured to control how the charts are drawn. The value of each axis or segment can be simple counts of records, or aggregations based on arithmetical or statistical operations like sums, minimums, maximums, or averages.
Insights are one of the many ways Aunalytics provides data-driven answers to your most important business and IT questions.

What is the Aunalytics Loan Default Risk Smart Feature?

Loan underwriting represents one of the most significant risk factors for financial institutions. Through nearly a decade of work with financial institutions, Aunalytics has developed an algorithm for training machine learning models that learn from your organization’s historical loan default data about the most significant factors predicting loan defaults among your customers. The Aunalytics Loan Default Risk Smart Feature™ provides a score of loan default risk based only on data available at the time of a credit application.
Our multi-indicator risk model significantly improves upon the accuracy provided by purely statistically-based risk models such as FICO scores and the actuarial tables used by underwriters to set interest rates. Although these basic statistical models are general guides to default risk, our model calibrates and quantifies how those variables and others impact loan defaults across loans of all types. For example, although low FICO scores are predictive of higher risk, how predictive they are depends on other factors such as the type of loan (mortgages, HELOCs, business loans, etc.), term, payment frequency, and so forth. For example, in one model trained using our proprietary algorithm on loan default data from one of our clients, the model discovered that for small business loans, payment frequency was actually more predictive of loan default than credit score. In other words, even borrowers with high credit scores would default on small business loans with monthly payment terms at a rate that wasn’t that different from borrowers with low scores. When payments were made semi-annually, however, credit scores became a much more predictive factor of loan default risk.
By digging deep into the complex relationships between different loan risk factors, our algorithm can produce impressive results. Performance tests on datasets have shown this algorithm to be highly precise, with one model trained on one of our client’s data the ability to predict 30% of loan defaults in a benchmark dataset with near perfect accuracy (0.99 precision at 0.30 recall) and could return consistently reliable results at higher levels of recall. The loan default risk models trained with our proprietary algorithm provide extraordinary business value to our clients in the financial services industry by flagging risky loans and providing a deeper understanding of risk factors involved with loan applications beyond basic ratings provided by an applicant’s FICO score.
Aunalytics is a data platform company delivering answers for your business. Aunalytics provides Insights-as-a-Service to answer enterprise and mid-sized companies’ most important IT and business questions. The Aunalytics® cloud-native data platform is built for universal data access, advanced analytics and AI while unifying disparate data silos into a single golden record of accurate, actionable business information. Its DaybreakTM industry intelligent data mart combined with the power of the Aunalytics data platform provides industry-specific data models with built-in queries and AI to ensure access to timely, accurate data and answers to critical business and IT questions. Through its side-by-side digital transformation model, Aunalytics provides on-demand scalable access to technology, data science, and AI experts to seamlessly transform customers’ businesses.

Top 10 Cyberattacked Industries in 2020
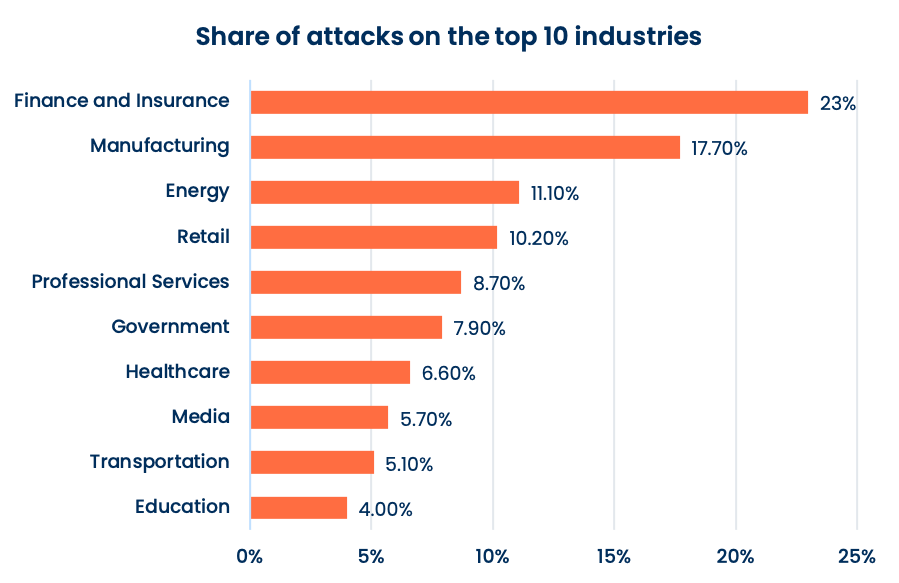
According to IBM in its X-Force Threat Intelligence Index, the top 10 industries suffering the most cyberattacks in 2020 were:
1. Finance and Insurance
Most Common Type of Attack: Server access attack
Since 2016, the finance and insurance industry has been the most attacked industry. In 2020, attacks increased over 2019 by 238%. Hackers seeking to profit financially from attacks often hit this industry. Paralyzing banks is usually less of a goal with attacks on this industry, but accessing internal systems can yield hefty illicit returns. However, during the pandemic, hackers seeking to paralyze infrastructure including nation-state cyber criminals also hit banking institutions to cause chaos.
2. Manufacturing
Most Common Type of Attack: Ransomware
The attacks against manufacturers doubled in 2020 compared to 2019. 21% of all 2020 ransomware cyberattacks hit the manufacturing industry. However, this industry also saw 4X more BEC attacks than any other industry, and a significant number of data theft attacks. Hackers renewed interest in this industry, likely trying to take advantage of supply chain disruption and operational chaos caused by the global pandemic, as consumers saw (and continue to experience) shortages in manufactured goods.
3. Energy
Most Common Type of Attack: Data theft
35% of attacks in the energy sector involved data theft, while only 6% involved ransomware. This was likely indicative of hacker motivations to hit this industry including IP theft, customer data theft and extorsion. BEC and server access attacks were also notable in this industry.
4. Retail
Most Common Type of Attack: Credential theft
Attacks on the retail industry were actually lower in 2020 than in 2019. This was likely due to fewer retail transactions taking place during the 2020 (less room to hide as a hacker). Retail is typically a target because of the high volume of credit card and financial transactions.
5. Professional Services
Most Common Type of Attack: Ransomware
Professional services saw the highest percentage of attacks from ransomware attacks of any industry. Data theft and server access attacks were also common in 2020. These organizations are typically attractive to cyber criminals because they serve as a path to further victims and often hold confidential data about customers.
6. Government
Most Common Type of Attack: Ransomware
Government received the second highest number of ransomware attacks of the industries, totaling a third of the attacks that this industry faced. Yet, only 38% of state and local government employees have been trained on ransomware prevention. This industry also faced a large burden in moving operations to accommodate work from home environments, as much of this industry had all team members working on site, and was not equipped for moving a remote workforce. Data theft attacks were also notable.
7. Healthcare
Most Common Type of Attack: Ransomware
The healthcare industry suffered twice as many cyberattacks in 2020 than in 2019, likely due to hackers taking advantage of operational chaos caused by the global pandemic, shifts in workforce to cover emergency medical care while furloughing operational and administrative staff due to revenue challenges caused by elective medical services being put on hold. Hackers, including nation-states looking to disrupt and steal data from organizations in this industry, targeted those in medical research and development attempting to invent COVID-19 vaccines, as well as frontline providers.
8. Media
Most Common Type of Attack: Malicious domain name squatting
90% of malicious domain name spoofing attempts targeted the media. This sector includes telecommunications and mobile communications providers, as well as media and social media outlets that can play a critical role in political outcomes, especially during election years. The timing of 2020 being a U.S. presidential election year likely drove this type of attack in this industry.
9. Transportation
Most Common Type of Attack: Malicious insider / misconfiguration
Attacks against the transportation industry were much lower in 2020, likely because everyone was sheltering in place and travel bans existed across the globe during 2020. This industry ranked #3 in 2019 and fell to #9 in 2020.
10. Education
Most Common Type of Attack: Spam / adware
Education has historically been vulnerable to cyberattacks due to a large decentralized surface area of users hard to control with staff and students regularly logging into systems from home to complete and grade course work. However, the user and device based security measures that this distributed surface area drove for security protection before the pandemic, better equipped education for security operations during the pandemic than other industries accustomed to relying on firewall protection.
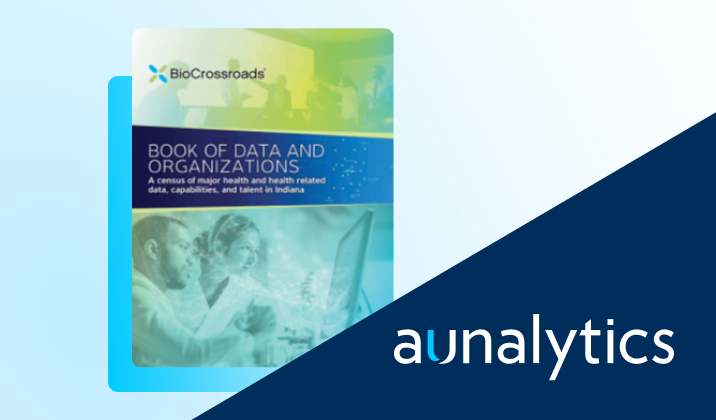
Aunalytics has been included in the 2021 BioCrossroads Book of Data and Organizations
Aunalytics has been included in the 2021 BioCrossroads Book of Data and Organizations directory of Indiana enterprises in the health-data intersection – it includes information on Indiana’s industry, government, health systems, academia, and digital health startups that have tremendous data and technology resources which are driving transformative healthcare and life sciences work locally and globally. The directory now includes snapshots of 40 organizations who control data assets – data sets, data talent, and/or data technology — as well as five cross-organizational initiatives, who collaborating for a specific data project or program.
Aunalytics, Inc. Profile
Role(s)
- Aunalytics is a data platform company delivering answers for your business. Aunalytics provides Insights-as-a-Service to answer enterprise and midsized companies’ most important IT and business questions. The Aunalytics® cloud-native data platform is built for universal data access, advanced analytics and AI while unifying disparate data silos into a single golden record of accurate, actionable business information. Its DaybreakTM industry intelligent data mart combined with the power of the Aunalytics data platform provides industry-specific data models with built-in queries and AI to ensure access to timely, accurate data and answers to critical business and IT questions. Through its side-by-side digital transformation model, Aunalytics provides on-demand scalable access to technology, data science, and AI experts to seamlessly transform customers businesses.
- Our healthcare industry revenue cycle management analytics focus provides AI and machine learning driven insights for reducing insurance reimbursement underpayments and streamlining billing to provide a data driven practice management solution.
Mission
We use data and technology to improve the lives of others.
History
Aunalytics began in 2011 when successful data center entrepreneurs in South Bend, Indiana partnered with data scientists from the University of Notre Dame to provide end to end business and IT analytic solutions backed by a cloud data center. Aunalytics aims to bring data and analytics to mid-market businesses, healthcare systems, and providers by our side by side model to provide clients with access to our data engineer and data science experts to harness data driven insights to better compete with large nationals. We provide healthcare industry specific data models and mine your data for insights to reduce operational costs and drive revenue.
About
- 250 team members in Indiana, Michigan and Ohio
- Enterprise cloud, data analytics, data management and managed services offerings powered by our data platform
- Industry specific data analytics – built for healthcare providers for revenue cycle management
- HIPAA compliant enterprise cloud
What is the Aunalytics ‘Propensity to Churn’ Smart Feature?
Customer churn represents lost opportunities as customers move their business to one of your competitors. At Aunalytics, we have nearly a decade of experience developing such models for clients in various industries, including financial institutions. For client subscribers to our Daybreak™ Analytical Database, the churn propensity report Smart FeatureTM offers a uniquely valuable dataset for understanding the risk factors that could indicate customers are about to take their business elsewhere.
The algorithm behind this Smart Feature was developed by studying historical customer churn data from many different client institutions to discover common patterns in the typical behaviors that precede account churn. One key approach to developing this algorithm was to redefine churn beyond simply customers who closed an account; instead, churn was defined to include customers who suddenly drew down a high-balance account and never returned that account balance to its previous level after a period of months. By looking at the data in this way, our data scientists were able to understand that the behaviors that predict churn often happen many months or years before an account is actually closed—for example, a customer stops using direct deposit or bill pay services, then withdraws most of the balance a few weeks to months later but doesn’t actually close the account for a few years.
 Based on this deeper look at the data, Aunalytics has been able to develop an algorithm that looks at numerous factors such as customer transactional data, the age of the account, the presence of ACH deposits prior to churn, number of debit card transactions per month, online banking login frequency, and length of the total customer relationship, among others. Once this algorithm is trained on a client’s data, we can provide that client with propensity to churn scores expressed both as a standard percentile (e.g. absolute probability in the range of 0-100%) and a decile score (e.g. a score from 1-10 where 1 is the group composed of the 10% of customers least likely to churn and 10 is the 10% most likely to churn). Using these Smart Features, our clients in financial services can understand immediately what the likelihood is that a customer will churn, or build datasets to target customers at risk of churn with offers and incentives that might keep them actively using those financial products.

How to Identify Which of Your Banking Customers are at Risk for Crypto Scams
The allure of investing early in the “next big thing” has led to interest in investing in cryptocurrency. Cryptocurrency is a type of digital or virtual money that exists in electronic form (no printed dollars or coins). As a new industry, it is highly unregulated compared to other types of investments and banking. While there is potential for a big win, there is strong potential for a big loss.

Crypto Buyer Profile
Crypto investors tend to be younger adults. They decide to put money into a crypto currency investment with the idea that the currency will gain value over time. When compared to current low and no interest checking and savings accounts rates, where money will not grow in a conventional banking account, crypto provides the promise of potential growth.
People use cryptocurrency for quick payments, to avoid transaction fees that regular banks charge, or because it offers some anonymity. It is typically exchanged person to person online (such as over a phone or computer) without an intermediary like a bank. This means that there is often no one to turn to if there is a problem with the exchange.
Crypto Risks
While some crypto investment opportunities may be speculative long term plays, unfortunately unscrupulous scammers have been attracted to the emerging industry. Investors may find their investment to be worth nothing and the value stolen by a scammer. New crypto currency brands emerge often and many consumers do not know which are legitimate. Because crypto currency is stored in a digital wallet, it is at risk from hackers stealing it. Because there is no banking intermediary, there is no one to turn to if there is fraud.
Crypto currencies are not backed by the government. So, if you store your crypto with a third party company that disappears or is hacked and your money is stolen, there is little to no recourse and the government has no obligation to help you get your money back.
Unlike with credit card purchases, returns and refunds are often not possible for purchases made with crypto because the unregulated industry does not offer these protections as standard.
Crypto currency values change rapidly and constantly. Value is based upon supply and demand. Unlike many investments that may fall in value but typically regain value over time, crypto is less stable. A purchase of $1000 could fall to a value of $100 in minutes. Conversely, it could rise to a value of $10,000 in minutes. But then it could change again – even while you are trying to cash out on your gain while up, it could result in a loss due to the value changing again before the transaction is complete.
How can you protect your banking customers from crypto fraud?
DaybreakTM for Financial Institutions was built specifically for mid-market banks and credit unions to get business outcomes using analytics. Daybreak can mine your transactional data to determine which of your customers has money leaving or entering your bank from a crypto currency company. This will give you an actionable list of customers for outreach and education on risks. If enriched with a listing of crypto companies known to be fraudulent, targeted outreach may be done by you to save your customers from fraud. Further, after explaining the risks of crypto and educating your customers, you may be able to offer an alternative investment opportunity to keep your customers safe and their dollars in your bank.
