Daybreak Insights
Visualize your queries to more easily discover patterns in your data, and share insights with anyone on your team.
Answers at a glance
Insights adds additional value to Daybreak™ by enabling users to take the results of queries and build visualizations that display the results in various forms such as line, column, or donut charts. By adding visualizations to Daybreak queries, users can see patterns and trends in the data. Users can share Insights with other users.
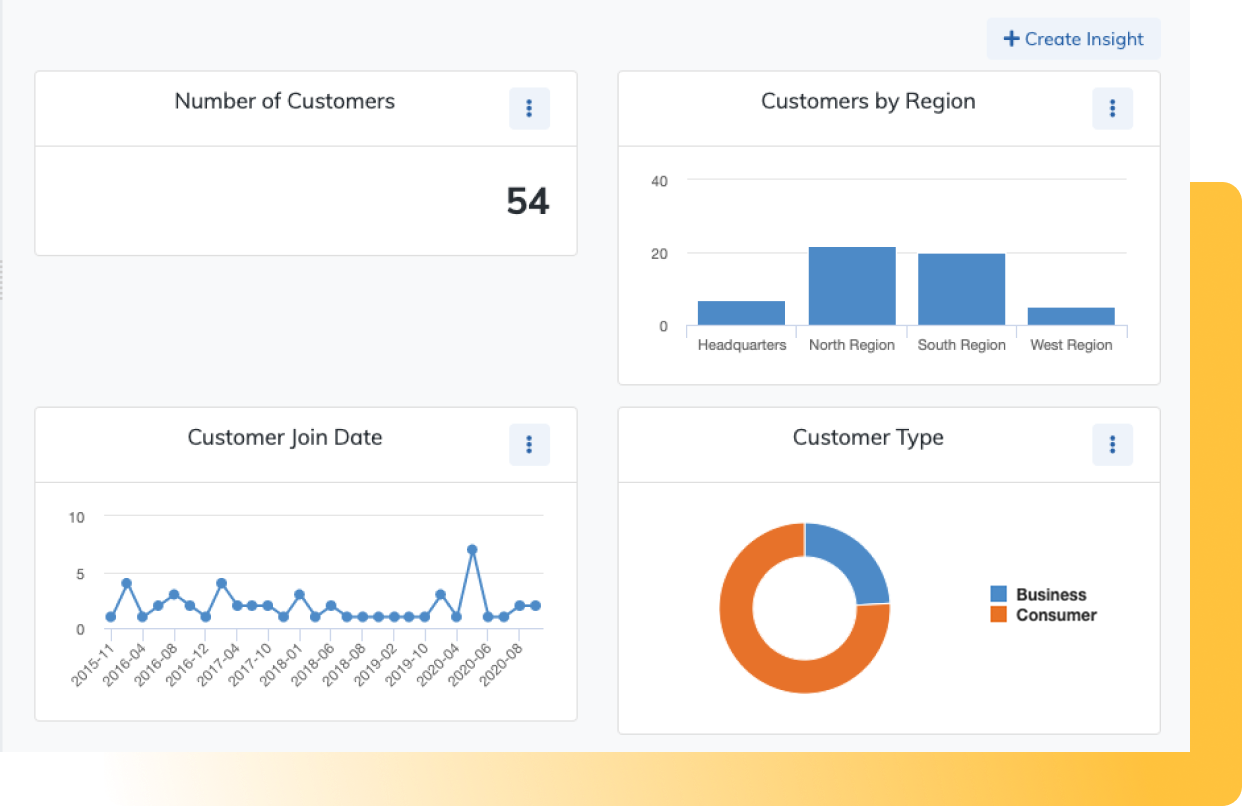
Examples of Daybreak Insights
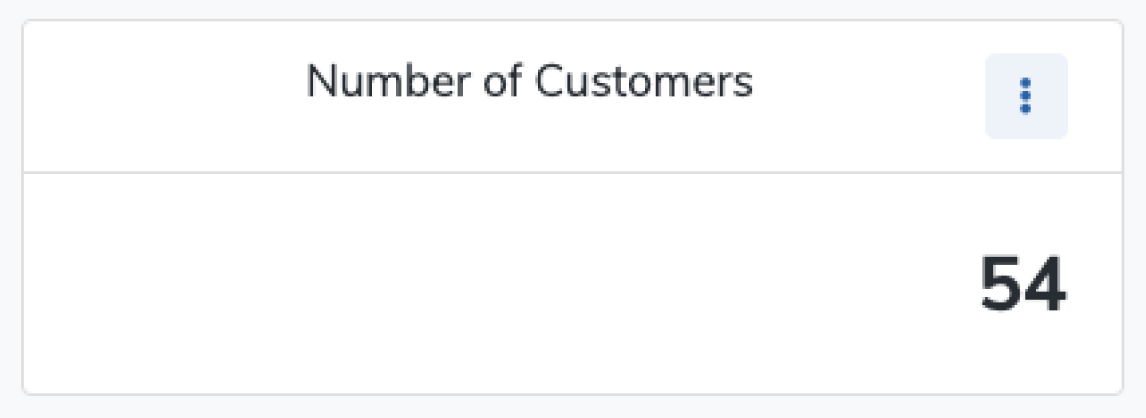
Summary
Summaries are numerical displays of a single value. They are useful for providing a simple numerical statistic, like the number of results or the average current account balance for customers in the results set.
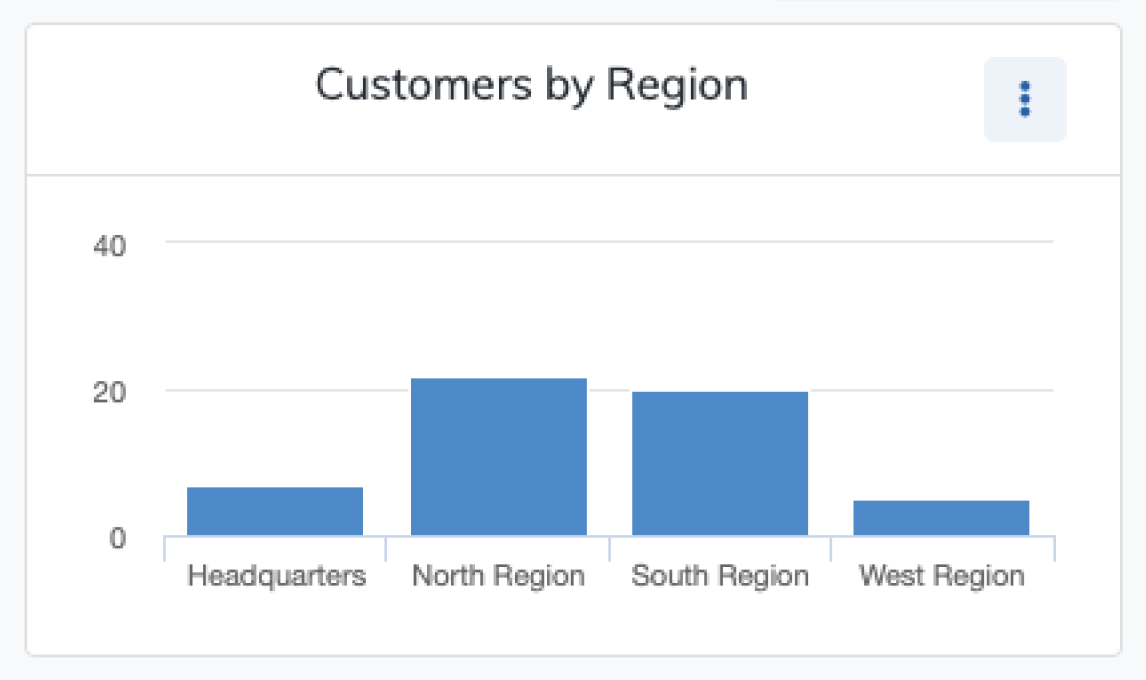
Column
Column Insights are column charts designed to display numerical data grouped by category. For example, viewing the number of customers grouped by region.
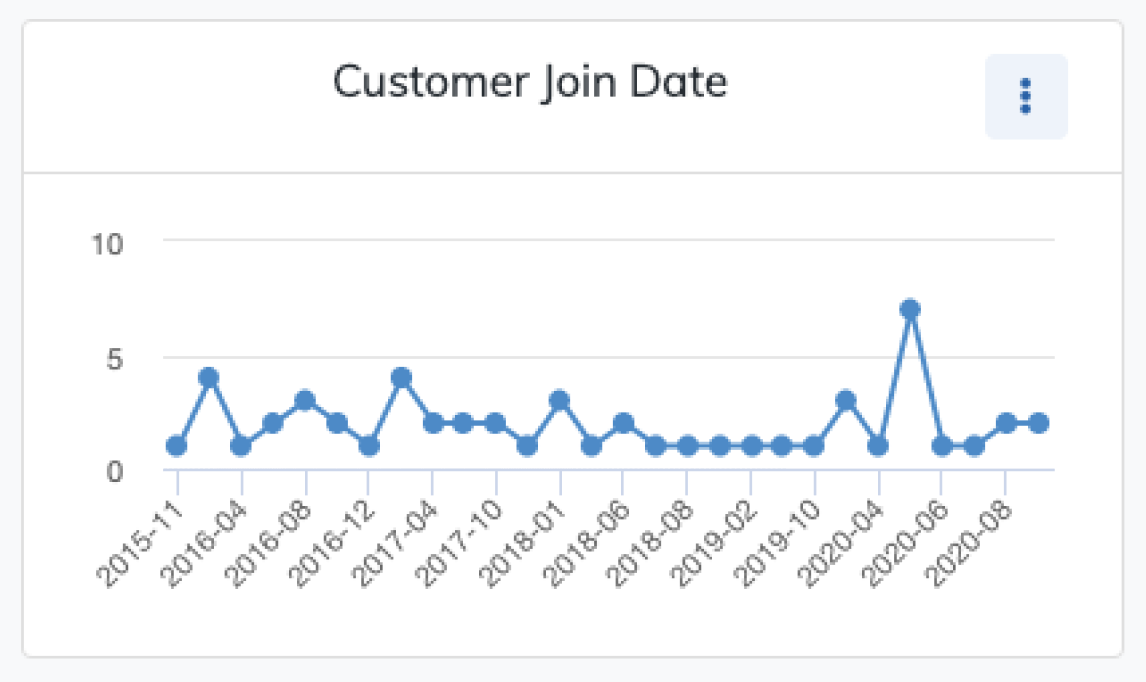
Line
Line chart Insights are plots of points across a time series on the horizontal axis. This is a good way to visualize trends over time.
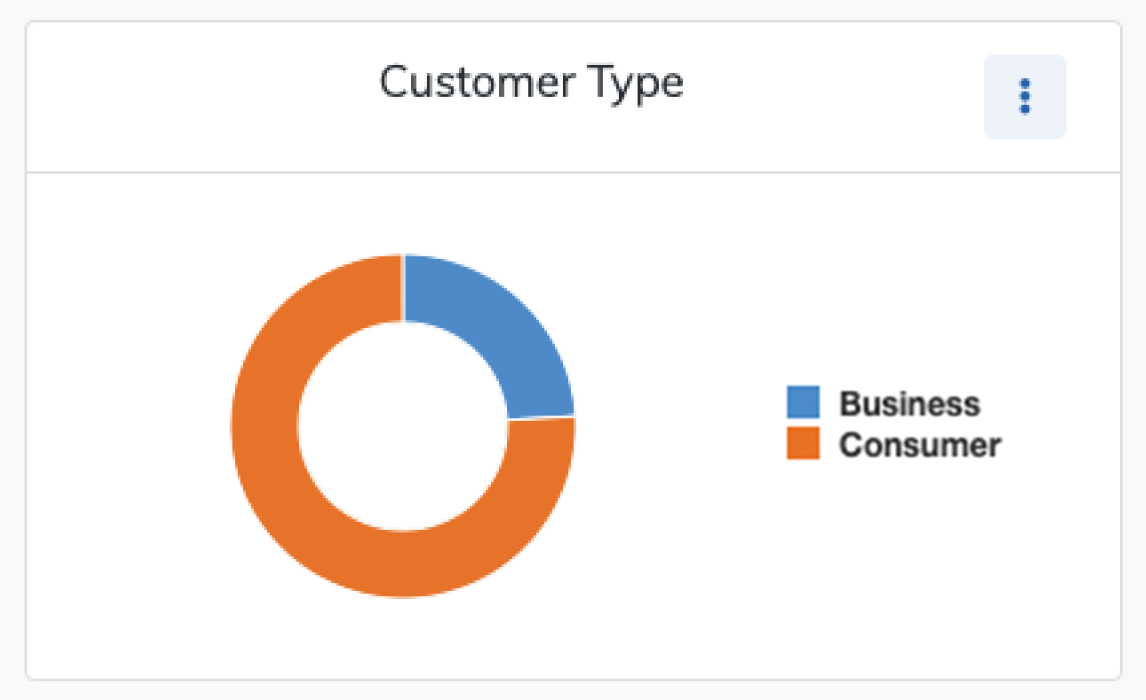
Donut
Donut chart Insights are visualizations of proportional distributions by category, such as the balance of consumer vs. business accounts.
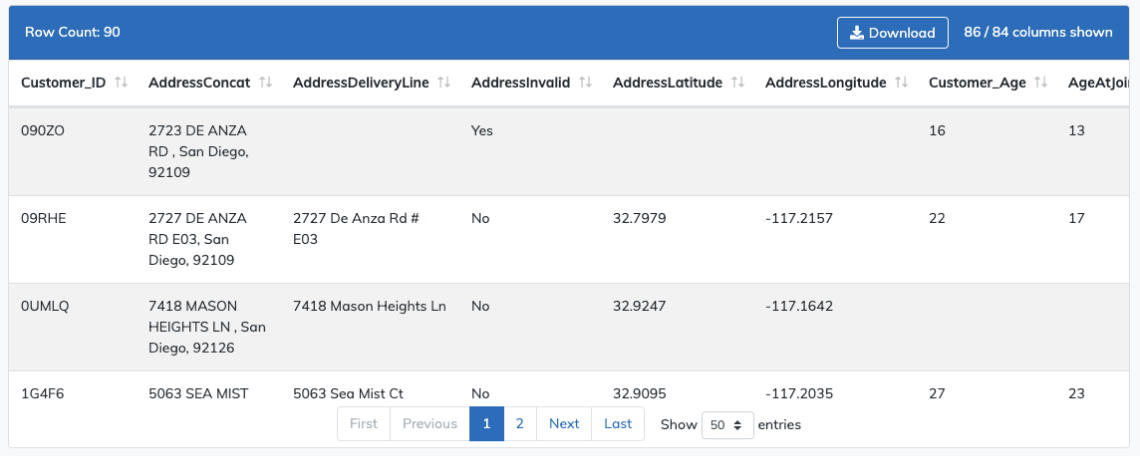
List of records
In addition, you can always view query results as a list of records to give you a more detailed view of the data.