
Daybreak’s Built-in Industry Intelligence Leads to Faster, More Actionable Insights for Banks and Credit Unions
When choosing a piece of technology for your business, it is important to consider technical specs, features, and performance metrics. But that isn’t all that matters. Even though a product or solution may fit all of your technical requirements, it might not be a great fit for your bank or credit union. As an all-in-one data management and analytics platform, Daybreak is a uniquely strong contender on technical abilities alone, but it also offers features specifically engineered to answer the most prevalent and actionable questions that banks and credit unions currently ask, or should be asking themselves, every day. This is made possible through its built-in industry intelligence.
Industry Intelligence Increases Speed to Insights
Daybreak was developed specifically to help mid-market banks and credit unions compete, leveraging the same big data and analytics technologies and capabilities as the largest, leading institutions in the industry. We know that financial services organizations have a wealth of data—but not all of it is actionable, nor even accessible in its current state. We quickly break down data silos and integrate all the relevant data points from multiple systems; including internal and external, structured and unstructured.
It is Industry Intelligent because our experience knows the kinds of questions an institution needs to answer—that is why over 40% of the data in our model doesn’t exist in the raw customer data. These new data points are called Smart Features.
Over 40% of the data in the Daybreak model doesn’t exist in the raw customer data. It is engineered using Smart Features.
Data Enriched with Smart Features Provides Actionable Insights
One huge advantage that Daybreak offers banks and credit unions is automated data enrichment, through the use of Smart Features. Smart Features are newly calculated data points that didn’t exist before. Daybreak utilizes AI to generate these new data points which allow you to answer more questions about your customers than ever before. For example, Daybreak automatically converts unstructured transactional data into structured Smart Features—converting a long, confusing text string to a transaction category. A transaction that looks like this in the raw data…
| CHASE CREDIT CRD CHECK PYMT SERIAL NUMBER XXXXXXXX |
Is converted to this data point, which can be easily analyzed or used to filter and analyze:
| Customer Number | Account Number | Destination Category | Destination Name | Recurring Payment |
|---|---|---|---|---|
| 123 | 456 | Credit Card | Chase | Yes |
Another category of Smart Features are new values that are calculated based on existing data. For example, Daybreak’s AI scans transactional data and determine which branch is used most often by each individual. It can look at person’s home address and determine which branch is the closest to their home. The AI also scans transactional data for anomalies, and flags any unusual activities, which may indicate a fraud attempt, or a life change. For example, if an account suddenly stops showing direct deposits, perhaps that customer has changed jobs, or is in the process of switching to a different bank.
Since these Smart Features are automatically created, you can start asking actionable questions right away, without waiting for complicated analysis to be performed.
Daybreak has pre-built connectors to most of the major core systems, CRMs, loan and mortgage systems, and other heavily utilized financial industry applications. This means we can get access to your data faster, including granular daily transactional data, and automatically serve it back in a format that you can use to make data-driven decisions. We’ve figured out the difficult foundational part so you don’t have to spend months of development time building a data warehouse from scratch—you will begin getting insights right away.
Daybreak aggregates data from multiple sources, and allows you to receive actionable insights right away.
Scale your Team’s Industry Experience with Daybreak
One challenge that organizations face with any new initiative is how to transfer knowledge and collaborate across departments or locations. If one team member creates a useful analysis or process, it can be difficult to share with others who may want to look at the same type of information. Daybreak’s Query Wizard makes it easy to share intelligence across your business by providing pre-built queries for common banking questions and insights. We also update the pre-built queries regularly with new business-impacting questions as they are formulated. Lastly, in a click of a button, any query is available in SQL code, providing a huge head start to your IT team in more advanced work that they would like to do.
The Daybreak Advantage
Unlike other “one-size-fits-all” technology solutions, Daybreak has financial industry intelligence and AI built into the platform itself. It allows banks and credit unions easy access to relevant data quickly, and without investing excessive time and money to make it happen. With Daybreak, business users have access to actionable data, enriched with Smart Features, in order to start answering impactful questions they’ve never been able to before. Your entire organization can utilize industry-specific insights and collaborate on data analysis.
Daybreak is a game-changer for banks and credit unions. Start making better business decisions by effectively leveraging your data today.

Solving Data Challenges for Mid-Market Community Banks
Mid-market community banks and credit unions are facing increased expectations from customers and members. As technology advances across all industries, people expect a highly-personalized experience. To provide a customized customer journey, banks and credit unions must utilize the wealth of data that is available to them—basic account information, CRM data, transactions, loan data, and other useful sources.
However, this requires an institution to overcome a number of challenges, including siloed data, poor data quality and governance, use of stale, non-actionable data, manual retrospective reporting, and overall lack of necessary analytics tools and talent. Building a strong, scalable, and automated data management foundation is necessary to realize a digital transformation and ultimately meet customer expectations through actionable analytics insights. Thankfully, these challenges are not insurmountable, and we have outlined the various challenges and put forward guiding principles to help your organization overcome them.
Asking the Right Questions, at the Right Time
Having access to data is powerful, but only if you are asking the right questions. Some organizations have hundreds of dashboards, but few of the insights are actionable. Others have specific questions they’d like to answer, but no easy way to create custom queries or visualizations to dig deeper into the data. It is important to arm all users with the tools necessary to analyze data in order to take action. Users need to be given the ability to utilize relevant pre-built queries or build their own, filter data, segment customers and members, and create meaningful lists. This is also dependent on having a strong, centralized data repository, built for analysis, that gives access to timely and accurate data.
Choosing the Right Technology
While modern core systems and other business applications have their uses, they are not equipped to handle enterprise-wide analytics. These databases systems of record and are meant to handle transactions, and while ideal for collecting and modifying records in real-time, they are not able to meet the needs of querying and analytics. Furthermore, when data is spread across multiple systems, there must be a central repository to aggregate all of this data. A cloud-based next-gen data lake or data warehouse is the ideal option in this situation. They are easily queried and the structure lends itself to analytical applications, including machine learning, predictive analytics, and AI. By building a strong foundation, for BI and analytics, community banks and credit unions make a huge leap towards digital transformation and more closely competing with their larger industry peers.
Breaking Down Data Silos
Financial institutions have no shortage of data. However, that data is usually siloed across many systems throughout the organization. Aggregating and integrating that data is a major challenge that in the best case scenario, can be difficult and time-consuming, and at worst, nearly impossible (such as with transactional data). It can be especially challenging when working with vendor-hosted systems, such as your core, mortgage, loan origination, mobile/online banking, and CRMs. All of this data offers key details into customer behavior, so it is important to utilize all sources to get a complete picture of individuals, as well as the institution as a whole. This is why a singular data warehouse or data lake is essential for analysis and reporting. When all the data from various sources is ingested into this system, via internal connectors and external APIs, it is far easier to query and link the data to gain a 360-degree view of each customer or member, and discover insights you’ve never had access to before.
Ensuring Data Accuracy
Having a wealth of data and insights at your fingertips is only helpful if that data is accurate. Whenever data is entered into a system manually, it is an opportunity for mistakes to be made. If a name is misspelled in one system, it may not be obvious that it is referring to the same person in another system. Valuable insights into that individual’s behavior may be lost. On the other hand, if, in the course of ingesting data from an outside system, there is an error, would it be easy to detect the data loss? One way to mitigate these scenarios is to implement quality assurance technology and best practices. In this way, data discrepancies can more easily be detected and flagged for correction. To take it a step further, data preparation automation tools can be used to correct common mistakes as the data is ingested into the platform.
Using Timely Data
There is nothing worse than making decisions based on stale data. Circumstances can change rapidly, and the ability to be proactive in customer and member relationships is key to providing the personalized experience they have come to expect. For example, if a customer is showing signs of potential churn, banks and credit unions need to know as soon as possible in order to intervene. Transactional databases are changing daily, so it is important to establish a system by which the foundational data repository is updated regularly. For this situation, automation is essential. Manually ingesting data on a daily basis is time-consuming and can be unrealistic for many community banks and credit unions. However, utilizing automated data ingestion and preparation ensures that the data will be updated as often as necessary, with minimal to no human intervention required.
Acquiring the Necessary Talent
Developing a foundational analytics platform is no easy task. It can take huge amounts of time and effort to build an analytics-ready data warehouse from scratch. From planning and strategizing, to actual execution, it can take many months just to get started with any BI or analytics initiative. In addition, it can be challenging, and costly, to recruit and hire data engineers, analysts, and data scientists to run and develop custom algorithms. One way that mid-market financial institutions can save time and effort is to utilize a data platform built specifically for the unique challenges of the banking industry to accelerate the development process. A product that also allows you to utilize pre-built queries, algorithms, and dashboards can also shorten the time to deployment and, ultimately, insights.
Granting Access to All Who Need It
Once the data is compiled, it can be a challenge to get it into the hands of decision-makers across the organization. Will people access data through dashboards? Do they need raw data to perform deeper analysis? Will everyone have access to all data, or will some only need a smaller subset? Using a tool that gives users the ability to interact with data in a variety of ways, be it through code or visualizations, and that gives varying levels of access, is key to managing corporate data governance. Having a centralized data repository also ensures that all users are interacting with the latest, most accurate data.
Daybreak: A Complete Solution for Banks and Credit Unions
While there are a number of challenges to overcome in becoming more customer- or member-centric, it all begins with a strong data foundation. That is why Aunalytics has developed Daybreak, an industry intelligent data model that gives banks and credit unions easy access to relevant, timely data and insights, as the sun rises. Daybreak is an all-in-one analytics solution that automates key tasks—data ingestion across multiple disparate sources, data transformation and preparation, and quality assurance practices—built on a secure, powerful cloud-based data platform, to ensure data is always up-to-date, accurate, and accessible across your organization. It also allows users to connect to any outside source, visualization, or BI tool of choice, or they can leverage Daybreak’s user-friendly, guided Query Wizard and SQL builder interfaces to get to actionable insights.
With Daybreak, anyone across your organization can gain a deeper understanding of individual customers and members, while also acquiring a high-level understanding of the business as a whole. With access to the right data, at the right time, your institution can make better business decisions, faster.
Six Stages of Digital Transformation for Financial Institutions
Many financial institutions have been around for decades. They’ve successfully implemented the technology advances necessary to stay relevant, such as using the latest core systems and implementing digital banking services for their customers. However, the journey to a complete digital transformation involves both technical changes as well as strategic and organizational changes. To truly embrace technology and prepare for the future, each financial organization must embark on a multi-phase process to reach their full potential. We have outlined the six stages of this transformation to give banks and credit unions a high-level roadmap of what needs to occur in order to realize a complete digital transformation.
1 | Business as Usual

In the first stage of digital transformation, banks and credit unions are still maintaining the status quo rather than experimenting with new digital initiatives. Some are still hosting their business applications internally and are spending significant amounts of time performing required compliance audits. They manually compile reports using pivot tables in Excel or other spreadsheet programs. While each department has its own reports, there is little to no aggregation of data across multiple departments; only a manually created deck assembled and shared once a month. This means that they are limited to basic reporting metrics rather than deep analytics.
While they may discover some insights in their current data metrics, the insights that are gleaned from these manual reports may not be easily acted upon. Small projects may be taken on by individual departments, but there are no formal processes, and these projects are largely siloed from one another. Many times, the IT department “owns” the digital initiatives, and they tend to be tech-first rather than customer-first. Therefore, organizations are unlikely to see any significant outcomes from the small, one-off projects that are taking place during this stage, and they do not drive the overall business strategy.
2 | Present & Active
As the technology landscape evolves, it can be easy to get excited about new products and services that promise to revolutionize the field. But many banks and credit unions are not ready to go all-in until these claims are tested. Oftentimes, an experimental pilot project will get off the ground within one department. For example, they may start pulling new operational reports out of their core banking system, utilize very basic customer segmentation for a marketing campaign, or consider moving to a cloud-based system to host some of their internal applications.
However, their data continues to be siloed, insights and best practices around new technology initiatives are not shared throughout the organization, and there is little to no executive-level involvement. However, for most banks and credit unions, dabbling in new strategies and technologies is the first step to creating a sense of excitement and building a case for digital transformation on a larger scale.
3 | Formalized
As banks and credit unions begin to see momentum build from existing pilot programs, it is increasingly easier to justify investments into new digital initiatives. In the past, marketing, customer care, and transaction core databases had been siloed; separate reporting for each was the norm. However, in the pursuit of digital transformation, moving internal applications to the cloud is an important milestone on the path to creating a single source of truth and making data accessible across the enterprise.
At this stage, a clearer path toward digital transformation emerges for the bank or credit union. More formalized experimentation begins, including greater collaboration between departments and the involvement of executive sponsors. The development of technology roadmaps, including plans to move systems to the cloud and expand internal or external managed IT and security services, ensures that the bank is strategically positioned to advance its digital initiatives.
4 | Strategic
The pace really picks up in the next stage as collaboration across business units increases and the C-suite becomes fully engaged in the digital transformation process. This allows banks and credit unions to focus on long-term strategy by putting together a multi-year roadmap for digital efforts. This is the stage where an omni-channel approach to the customer journey becomes realistic, leading to a unified customer experience across all touch points—both physical and digital. Technology is no longer implemented for the sake of an upgrade, but rather, to solve specific business challenges.
However, some challenges may present themselves at this stage. As data is more freely accessible, the quality and accuracy of the data itself may be called into question. This accentuates the need for a strategic data governance plan for the bank or credit union as a whole.
5 | Converged
Once digital champions have permeated both the executive team and the majority of business units, it becomes necessary to create a governing body or “Center of Excellence” focused specifically on digital transformation initiatives and data governance across the company. This structure eliminates repetitive tasks and roles, and allows for a unified roadmap, shared best practices, and the development of a single bank-wide digital culture and vision.
Banks and credit unions can further refine their omni-channel approach to optimizing the customer experience by creating customer journey maps for each segment. This leads to optimization of every touchpoint along the way, both digital and traditional, and informs the overall business strategy. Marketing can start to run and track highly personalized campaigns for current customers and new customers.
At this point, one-off tools are abandoned in favor of an all-encompassing cloud analytics platform to gather, house, join, and clean data in order to deliver relevant, up-to-date insights. All employees are trained on digital strategy, and new hires are screened for their ability to contribute in a digitally transformed environment. In the Converged stage, digital transformation touches every aspect of the business.
6 | Innovative & Adaptive
The final stage of the digital transformation journey can be defined by continued experimentation and innovation, which, by now, is a part of the organization’s DNA. Investment in the right people, processes, and platforms optimize both customer and employee experiences, as well as operations of the bank or credit union as a whole.
Through the Center of Excellence group, pilot projects are tested, measured, and rolled out, providing a continuous stream of innovation. The data, reporting, and analytics capabilities of the omni-channel cloud analytics platform are integrated across every department, spreading from Marketing into Sales, Service, and HR, among others. Full personalization of marketing campaigns target customers that have triggers in their checking, mortgage, or wealth management accounts, or through actions taken via customer care or app. This allows the bank or credit union to make relevant recommendations on products such as loans, refi, wealth, etc.
Training programs are set up to bring all employees up to speed on the iteration and innovation cycle, and HR is closely involved in filling the talent gaps. Financial institutions may partner with or invest in startups to further advance their technology and innovation initiatives.
Conclusion
By embracing new technologies and setting up the processes necessary for a complete digital transformation, banks and credit unions are able to personalize the customer experience, enhance and streamline operations, and stay nimble in the face of changing times. No matter where your organization currently falls on this journey, your partners at Aunalytics will help you reach your ultimate goals by providing technology, people, and processes that can take your bank or credit union to the next level.
This article was inspired by research by Altimeter, as summarized in “The Six Stages of Digital Transformation” which can be downloaded here.

4 Ways Disparate Data Sets Are Holding You Back
As an enterprise with a lot of different sectors and moving parts, having disparate, siloed data is hard to avoid. After all, the marketing department may deal with certain information while the IT team works with other data. The details the finance department leverages aren’t the same as what’s used by HR, and so on. However, when this information exists in separate silos and never fully comes together, it could be holding your organization back considerably, particularly when it comes to your big data initiatives.
Today, we’ll look at just a few of the ways disparate data sets could be a problem for today’s companies, and how your business can help address this prevalent problem.
1) A world of enterprise apps
One of the biggest sources of disparate data is the range of business applications employee users leverage. While these activities may take place under the watchful eye of the IT team, each application will contain information unique to that platform and if this data isn’t brought together at some point, it can create skewed analytics results.
According to Cyfe, the average small business utilizes just over 14 different applications. This number jumps to 500 when examining large enterprises.
“[T]he more apps your organization uses the harder it is to make data-driven decisions,” Cyfe noted in a blog post. “Why? Because keeping a pulse on your business’ sales, marketing, finances, web analytics, customer service, internal R&D, IT, and more as isolated sources of data never gives you a complete picture. In other words, big data doesn’t lead to big insights if you can’t bring it together.”
2) Stuck in the information-gathering phase
It’s not only the location of data that can cause an issue – the sheer volume of information can also create significant challenges, particularly when an organization is working to gather all of that information in a single place.
“It can take considerable time to bring this information together without the right resources.”
Informatica pointed out that that as much as 80 percent of an analytics initiative involves the actual collection of information in order to establish a bigger, better picture for analysis. However, when a large number of details are located in several different locations, it can take considerable time to bring this information together without the right resources. What’s more, as the company is working to pull data from different sources, new, more relevant information is being created that will further impact analysis.
In this type of environment, it’s easy to get stuck in the gathering phase, where data is constantly being collected, while the team doesn’t move on to the analysis part of the initiative as quickly as they should.
3) Fear of missing out: Reducing repetition
This leads us to the next issue: fear of missing out. Because big data is constantly being created and changing so quickly, businesses may hesitate to analyze and leverage the insights due to a fear of missing out on the next piece of data that is just coming to light.
Furthermore, Informatica noted that when data isn’t organized and kept in several different locations, it can cause problems on not just one, but a number of analysis initiatives, as employees will have to repeatedly pull these details, wasting time and effort.
“The key to minimizing repetitive work is finding a way to easily reuse your logic on the next data set, rather than starting from square one each time,” Informatica pointed out.
This is only possible, however, with the right big data platform that can help gather information from all disparate sources in the shortest time possible. In this way, businesses can eliminate costly repetitive processes while still ensuring that nothing falls through the cracks as information is gathered for analysis.
4) Missing information: Is it possible to know what isn’t there?
Siloed data can also lead to gaps in knowledge, which can considerably impact analysis results. For instance, a company seeking to learn more about their client base may include a range of different data sources, but may overlook details in the customer relationship management solution, causing them to miss important insights about brand interactions. While this is an extreme example, it helps illustrate the pitfalls of incomplete data sets.
Addressing disparate data: Partnering for success
These are challenges that can affect businesses in every sector, but can be easily and expertly addressed when companies partner with a leading big data solution provider like Aunalytics. Aunalytics has everything your enterprise needs to fully support its big data initiatives. Our unique, best-of-breed technology, Aunsight, ensures that information is gathered from all disparate sources, and that analysis is always as complete as possible. We help you collect and integrate your data so that workflows and unique algorithms can be established, leading to the most high-quality, actionable insights.

What is Little Data and what does it mean for my big data initiatives?
Big data has been the buzz of the business world for years now, with businesses across every industrial sector gathering and analyzing information in an effort to leverage the resulting actionable insights. For the past few years, “big” has been the name of the game, with organizations working to indiscriminately collect as many details in a whole host of different areas.
Now, however, a new strategy is coming to light: little data. But what, exactly, is little data? How is it related to big data? And how can this approach make all the difference for your business?
Little data: A definition
Little data comes in almost exact contrast to big data, but can also be complementary – and very important – to supporting a big data strategy.
According to TechTarget, little, or small, data are more selective pieces of information that relate to a certain topic or can help answer a more specific pain point.
“Little data comes in almost exact contrast to big data.”
“Small data is data in a volume and format that makes it accessible, informative and actionable,” TechTarget noted.
The Small Data Group further explains that little data looks to “connect people with timely, meaningful insights (derived from big data and/or ‘local’ sources) organized and packaged – often visually – to be accessible, understandable, and actionable for everyday tasks.”
A step further: What’s the difference?
The key differences here are demonstrated by big data’s defining characteristics. Big data, as opposed to little data, is often defined by what are known as the three V’s, including volume, variety and velocity. The first two are particularly important here. Whereas big data usually comes in the form of large volumes of unstructured or structured information from a range of different sources, little data simply doesn’t cover as much ground.
Little data, on the other hand, comes from more precise sources and will include a smaller amount of information in order to address a previously defined problem or question. Where big data is vastly collected and then analyzed for insights that might not have been accessible previously, little data is gathered and analyzed in a more specific way.
Forbes contributor Bernard Marr noted that little data typically includes more traditional key performance metrics, as opposed to large, indiscriminate datasets.
“Data, on its own, is practically useless. It’s just a huge set of numbers with no context,” Marr wrote. “Its value is only realized when it is used in conjunction with KPIs to deliver insights that improve decision-making and improve performance. The KPIs are the measure of performance, so without them, anything gleaned from big data is simply knowledge without action.”
Little data and big data: Working in tandem
However, this is not to say that little and big data cannot work together. In fact, little data can help bring additional insight and meaning to the analysis results of big data.
For instance, a big data analysis initiative could show certain patterns and facts about a business’s customers. Little data can then bring even more to the table, helping to answer more specific questions according to key performance indicators.
These KPIs can also be utilized to measure an organization’s ability to put its big data insights to work for the business.
“For example, a retail company could use a big data initiative to develop promotional strategies based on customer preferences, trends and customized offers,” Marr noted. “But without traditional KPIs such as revenue growth, profit margin, customer satisfaction, customer loyalty or market share, the company won’t be able to tell if the promotional strategies actually worked.”
Little data in action
Little data can also be more personal in nature, offering knowledge and actionable insights for a company’s consumers. Nowhere is this more prevalent than in the fitness industry, particularly with the popularity of wearable fitness monitors that sync to a user’s mobile device.
Harvard Business Review contributor Mark Bonchek noted that oftentimes, little data pertains to each consumer as an individual, and that these details are what companies seek out to utilize as part of their big data strategies.
“Big data is controlled by organizations, while little data is controlled by individuals,” Bonchek wrote. “Companies grant permission for individuals to access big data, while individuals grant permission to organizations to access little data.”
Returning to the wearable fitness device example, little data would comprise the informational insights that are delivered by the tracking module, including distance traveled, weight changes, calorie intake, etc. A big data initiative related to these findings would require that the consumers utilizing these fitness trackers grant access to this information. From here, an organization could analyze a whole host of little data sources to offer a more global, overarching look at users’ habits.
Leveraging big and little data
If your company is interested in harnessing the power of little data as part of a big data strategy, it’s imperative to have a partner that can help fill in any gaps. Aunalytics has access to a variety of data sets, including those that can provide the right insights for your business.
Understanding Analytics Part 2: Top External Sources of Big Data
Big data analysis is one of the most powerful strategies today’s corporations have in their repertoire. Gathering and analyzing relevant information to better understand trends and glean other insights can offer a nearly endless number of benefits for companies as they look to offer better customer services and enhance their own internal processes.
Before that analysis can result in impactful insights, though, a company must first collect the information they’ll leverage as part of the initiative. Different datasets will provide different results, and there are a range of sources where these details can come from.
In the first part of this series, we examined a few of the top internal sources of data, including transactional information, CRM details, business applications and other company-owned assets. These sources are already under the business’s control, and are therefore some of the first places data scientists look as part of their information gathering efforts.
Sometimes, however, this data isn’t enough. Whether the organization is seeking to answer broader questions about the industry, or better understand potential customers, these initiatives may require the analytics team to look outside the company’s own data sources.
When this takes place, it’s critical that the enterprise understands the most valuable places to gather data that will best benefit its current processes. Today, we’ll take a look at the top sources of external data, including public information that isn’t owned by the company.
Social media: Connecting with your customers
One of the most robust external big data sources is social media channels, including Facebook, Instagram and Twitter. These sites have become incredibly popular – not only for individual customers, but for corporations as well. Through social media profiles, businesses can put an ear to the ground, so to speak, and get a better understanding of their current and potential customers.
And with so many users flocking to these platforms, the potential for big data is significant:
- Facebook had more than 1.5 billion active users as of April, 2016.
- Twitter had 320 million active users in the first quarter of this year.
- Instagram had 400 million active users in early 2016.
- Other platforms aren’t far behind: Snapchat boasts more than 200 million users, Pinterest and LinkedIn were tied at 100 million active users.
In addition, helpful sources like Facebook Graph help companies make the best use of this information, aggregating a range of details that users share on the platform each day.
“Social media data can be incredibly telling.”
Overall, social media data can be incredibly telling, offering insights into both positive and negative brand feedback, as well as trends, activity patterns and customer preferences. For instance, if a company notices that a large number of social media users are seeking a specific type of product, the business can move to corner the market and address these needs – all thanks to social media big data insights.
Public government data
While social media information is no doubt powerful, this isn’t the only external data source companies should pay attention to. The federal government also provides several helpful informational sources that help today’s enterprises get a better picture of the public. According to SmartData Collective, few of the best places to look here include:
- Data.gov: This site was recently set up by federal authorities as part of the U.S. government’s promise to make as much data as possible available. Best of all, these details are free, and accessible online. Here, companies will find a wealth of data, including information related to consumers, agriculture, education, manufacturing, public safety and much more.
- Data.gov.uk: Businesses looking for a more global picture can look to this site, where the U.K. government has amassed an incredible amount of metadata dating back to 1950.
- The U.S. Census Bureau: The Census Bureau has also made a range of data available online, covering areas such as overall population, geographical information and details related to regional education.
- CIA World Factbook: The Central Intelligence Agency no doubt has huge repositories of information at its disposal, and has made select information available via its online Factbook. This resource provides data on global population, government, military, infrastructure, economy and history. Best of all, it covers not only the U.S., but 266 other countries as well.
- Healthdata.gov: Health care information can also be incredibly powerful for companies in that industry, as well as those operation in other sectors. This site provides more than 100 years of U.S. health care information, including datasets about Medicare, population statistics and epidemiology.
Google: The data king
Google has also provided a few key, publicly available data sources. As one of the biggest search engines in the world, Google has a wealth of information about search terms, trends and other online activity. Google Trends is one of the best sources here, providing statistical information on search volumes for nearly any term – and these datasets stretch back to nearly the dawn of the internet.
Other powerful sources provided by Google including Google Finance, which includes 40 years of stock market data that is continually updated in real time. In addition, Google Books Ngrams allows companies to search and analyze the text of millions of books Google has in its repository.
The right data: Answering the big questions
Overall, in order for businesses to answer the big questions guiding their initiatives, they must have access to the right data. Public, external sources can help significantly, as can a partnership with an expert in the big data field.
Aunalytics can not only help today’s enterprises gather and analyze their available information, but can also help fill any gaps that might hold back the success of an initiative. Our scalable big data solutions ensure that your organization has everything it needs to reach the valuable insights that will make all the difference.
Understanding Analytics Part 1: Top Internal Sources of Big Data
There’s no arguing the power of big data in today’s corporate landscape. Businesses are analyzing a seemingly endless array of data sources in order to glean insights into just about every activity – both inside their business, as well as those that are customer-facing. Right now, it seems that enterprises cannot get their hands on enough big data for analysis purposes – the opportunities and advantages to be had here are tempting, as well as actionable, and can really make all the difference for today’s companies.
However, as corporations’ hunger for data grows, so too does their search for usable data sources. There are several places where businesses can gather and collect big data, both inside and outside of their own organizations. Currently, there are a more than a few data brokers that will sell lists of information – and while these may seem helpful, it’s up to the enterprise to analyze and make the best use of this data.
What’s more, without the proper knowledge, skills and support, these lists can be incredibly ineffective and, therefore, not worth the investment. Before businesses turn to data brokers, there are a few key places that they can look to gather their own big data. Let’s take a look at some of the top informational sources, and how these can benefit your organization, no matter what industry you operate in.
Internal vs. external
Before we get into the specific sources themselves, it’s important to understand the main classification of these datasets. Overall, there are two main categories that big data can fall under: internal or external.
“Internal sources of data reflect those data that are under the control of the business,” Customer Think contributor and data scientist Bob Hayes explained. “External data, on the other hand, are any data generated outside the wall of the business.”
In this way, internal data is the information that the business already has on hand, has control of and currently owns, including details contained within the company’s own computer systems and cloud environments. External data is information that is not currently owned by the company, and can include unstructured, public data as well as information gathered by other organizations.
Today, we’ll take a deep dive into internal data sources, including those that are currently controlled by the organization under its own roof.
Internal data: Company-owned information systems
Before decision-makers and data scientists look for external sources, it’s critical to ensure that all of a business’s internal data sources are mined, analyzed and leveraged for the good of the company. While external data can offer a range of benefits that we’ll get into later, internal data sources are typically easier to collect and can be more relevant for the company’s own purposes and insights.
There are a number of impactful, internal places that companies can look to mine data. These include:
- Transactional data and POS information: One of the most powerful sources of data resides within a firm’s financial and transactional systems. Here, companies can mine both current and historical data relating to their own business purchases, as well as information relating to the shopping trends of their customers. From these details, an organization can glean important insights, including ways to reduce their own spending and remain on budget, as well as crucial patterns pertaining to their customers’ buying habits and shopping preferences.
- Customer relationship management system: In addition to their purchasing and shopping data, businesses can also mine data within their own CRM systems. Information like clients’ company affiliations, locations and other regional or geographical details can paint a detailed picture about where customers are located. When combined with their transactional information, these CRM details become even more powerful.
- Internal documents: Especially now within the age of cloud computing, a company’s own internal documents are becoming more valuable than ever. Digitized copies of internal forms can provide a robust source of information, particularly when it comes to the business’s activities, policies and processes. Kapow Software noted in an infographic that emails, Word documents, PDF, XML and a range of other internal docs can be mined for big data.
- Archives: When it comes to internal information, businesses shouldn’t limit themselves to only the most current information. Historical data can be very telling as well, which is why Kapow Software recommends looking into the company’s archived documents and data streams as well.
- Other business applications: While CRM is one of the most robust internal sources of big data, this doesn’t mean that other internal applications cannot be mined. Other platforms that employee users leverage, including project management, marketing, productivity, enterprise resource management, human resources, expense management as well as automation apps can be incredibly beneficial as well. When mining these sources, it’s in a company’s best interest to let the nature of their big data initiative drive their decisions surrounding which sources to utilize. For example, if an organization is looking to gain insight about the current budget, sources like expense tracking and resource management will be the most helpful.
- Device sensors: The Internet of Things is growing every day, and providing additional and increasingly unique data for analysis. Companies that utilize devices that are equipped with sensors and network connectivity can leverage these for data as well. These include IoT items that the business uses in its own office, or those that it provides for its customers. For instance, car sensors on an enterprise’s fleet of vehicles can offer a wealth of data about usage, mileage, gas and traveling expenses. Companies that offer fitness or other health sensors can gather, anonymize and analyze these sources as well.
“Internal data sources are typically easier to collect and can be more relevant.”
Internal big data: Answering the big questions
Overall, internal sources of big data can offer numerous advantages for today’s businesses. Not only are these sources incredibly telling and relevant, but they’re free of cost to the company, as this is information that the organization already owns. In this way, enterprises can launch an array of big data initiatives without ever looking beyond their own walls.
However, when it comes to analyzing these sources, it’s best to have an industry-leading partner like Aunalytics that can help your firm answer the big questions. Aunalytics specializes in big data analysis, and can help pinpoint the source that will provide the most valuable and competitive advantage for your company. To find out more, contact Aunalytics today.
And check out the second part of this series, where we investigate the top external sources of big data, and how these can be best utilized.

What Can Clickstream Data Tell You About Your business?
Today, more businesses leverage big data to inform important decisions than ever before. This information can come from a range of different sources, each of which paints an insightful new picture of the company, its customers or both. However, in order to reap these benefits, organizations must not only have the data itself, but the skills and understanding to analyze and apply it in the best way possible.
One of the most revealing sources here is clickstream data, which can offer numerous advantages for businesses.
What, exactly, is clickstream data?
Before we get into the actual application of clickstream data, it's important to understand what this information is and where it comes from.
Clickstream data can be thought of as a roadmap of a user's online activity. This information represents digital breadcrumbs that show what websites a user has visited, what pages they viewed on that site, how long they spent on each page and where they clicked next.
"A clickstream is the recording of what a user clicks while browsing the web," Mashable explained. "Every time he or she clicks on a link, an image, or another object on the page, that information is recorded and stored. You can find out the habits of one individual, but more useful is when you record thousands of clickstreams and see the habits and tendencies of your users."
Clickstreams can be stored on the server that supports a website, as well as by a user's own web browser. In addition, internet service providers and online advertising networks also have the capability to record and store clickstream information.
What's included in clickstream information?
Diving a little deeper here, there are a range of insights clickstream data can offer, starting at the beginning of a user's journey.
For instance, clickstream information can show what terms an individual plugged into a search engine in order to reach the company's page. These details can reveal any other websites the user might have visited before reaching the business's website. Once the visitor has reached the site, clickstream data can show what page the person first landed on, what features or capabilities he or she clicked on once there, how much time was spent on that page and where the online journey took him or her after that page.
But clickstream data doesn't end there. In addition to revealing which pages a user visited and in what order, this information can also show any use of the "back" button, as well as when and where items were added or removed from a shopping cart.
While clickstreams do not include personal details of the users themselves, when collected and analyzed, this information can be applied to numerous improvements to the company's website and overall online presence.
Applying clickstream analysis: How can my business benefit?
There are several ways businesses can make use of clickstream analysis, including to enhance the experience users have with the brand. Let's take a look:
1. Identifying customer trends: Thanks to clickstream information, companies can see the path customers have taken in order to get to their site. By collecting and analyzing the clickstreams of a large number of customers, an enterprise can identify certain similarities and trends that they can leverage to the organization's advantage. For instance, if a majority of users utilized the same search term to reach a site that led them to the brand's website, the company can eliminate the middle man and ensure that their site is optimized for that search term.
2. Different pathways lead to the same destination: Clickstream data can also be leveraged to view the different routes customers might have taken to reach a product page.
"Just as drivers can take different roads to arrive at the same destination, customers take different paths online and end up buying the same product," Qubole noted. "Basket analysis helps marketers discover what interests customers have in common, and the common paths they took to arrive at a specific purchase."
Using these details, the company can look to create the most efficient path possible for customers, ensuring that they quickly and effectively locate the product they're looking for and can easily complete their purchase.
3. Preventing abandonment: In addition to "cart abandonment," analyzing the positive website interactions, clickstream data can also reveal the top pages where the most visitors leave the site. For instance, if a large number of users exit the site on a certain page, it could be very telling about the page itself. It could be that a feature on that page isn't working as it should, or the website is asking users for information that they aren't ready to give at that juncture. Whatever the reason, clickstream can show which pages on a site may need extra attention and improvement.
Best of all, this is only the beginning when it comes to clickstream data. These details can reveal even more when they belong to registered users - here, demographic information is made available, enabling the company to create targeted ads and other, more personalized offers.
Clickstream data can be incredibly powerful for today's companies, but only if firms have the skills and resources necessary to capture, collect and analyze this information. Aunalytics is a top expert in this field, providing the technology necessary to support clickstream analysis. To find out more about how this process can benefit your business's unique needs, contact the experts at Aunalytics today.
The Internet of Things: Challenges, Insights, & The Future
This month, we sat down with Aunalytics’ Vice President of Predictive Modeling, David Cieslak, PhD, to discuss his work on Internet of Things (IoT) analysis. We talked about the unique challenges of this type of project and what he’s learned, interesting insights he has discovered, and his thoughts on the future of the IoT field.
Q: How does an IoT project differ from other kinds of machine learning problems you have faced, and how are they similar? Are there differences within the data itself? Do you tend to use different methods of analysis
DC: It is exciting for Aunalytics to engage in the Internet of Things. A data scientist or machine learning researcher is especially captivated by this kind of problem for a variety of reasons. Beyond working on a high profile, cutting-edge area that brings a lot of hype and excitement, IoT data is very rich. Like responsibly collected web traffic utilized in clickstream analysis, a data scientist can walk into an IoT project with reasonable assumptions for high levels of data capture and information quality as data is being collected via autonomous, digital sensors. Such sensors do a good job of collecting a variety of data points pertaining to device operation, location, and user interaction. These values are often logically and consistently encoded; in some cases they are tailor-made with analytics or data science in mind. The implication is that a data scientist can often assume a higher starting point.
While the overall signal quality often presents a better opportunity, such a challenge can put a data scientist’s quantitative skills and creativity to the test. Algorithmically, data scientists might be asked to get out of their comfort zone and utilize advanced signal processing methods in order to provide digestible information. Likewise, time series analysis and anomaly detection feature more heavily in the IoT domain. Whereas hand-crafted featurization was often sufficient for other types of projects, IoT almost necessitates advanced, automated quantization strategies in order to keep up with the pace of data and business. The rules of the IoT game are being written in-flight and it’s critical for a data scientist to be able to learn and adapt to what works and what doesn’t, particularly within this domain. This requires the ability to understand contributions from many different engineering and mathematical disciplines and leveraging prior work from a variety of sources while simultaneously boiling down complexity without making the subject matter overly simplistic.
Q: What specific challenges have you faced in terms of analysis of device data? What lessons have you learned so far?
DC: The biggest issue surrounding IoT data is scale. Historically, a “more is better” approach has been taken with regards to logging, but this can have very practical implications on analysis. Sensors on an IoT enabled device might generate a status snapshot every second or even more frequently. Even a single record generated every second means that you’ll be responsible for storing and processing 86,400 records of data per device every day. If you have a fleet of 10 devices generating 10 pieces of data in every snapshot, it’s easy to imagine how quickly 8.6 million daily records can begin to saturate even the bulkiest big data solutions available. Whereas data scientists have typically been begging for more data, it’s very easy to see how they might drown in this environment. One very real decision that must be made is to determine what data is collected and how often and whether any sampling must be done in order to accommodate analysis. As always, this depends on the application and the availability of data processing resources. Sampling fridge sensors every 5 minutes might lead to a miss in temperature spikes that cause your $50 Ahi steak to go bad. Sampling a subset of vehicle dynamics every 5 minutes might miss a rapidly evolving failure and lead to a fatal accident.
Relatedly, it can be very challenging to boil down a lot of data to the audience. While this is a pervasive challenge in data science, the temporal nature of the signals we’re receiving mean that it’s even more challenging for a data scientist to translate a relevant, high-level inquiry into something structured and measurable. This puts a lot of responsibility on a data scientist to have a sufficiently broad and workable “statistical vocabulary” to satisfy highly curious audiences.
Q: What kinds of “insights” have you been able to uncover with clients?
DC: So far, we’ve looked at IoT through a lens of consumer products. This focus has led us to uncover interesting utilization patterns. Our customers have invested heavily into engineering product features development but what we find is that in many instances customers lock into a small subset and use them habitually. The good news is that the utilized features are often fairly unique per customer, so few features are truly going to waste. This also represents an opportunity for our clients to develop outreach programs for better product education.
While product and engineering research is important, this can also translate into savings for the customer as well. Depending on where they live, they might be able to save money on their electrical bill by using appliances at specific points in the day. Likewise, business experts may be able to help clients use their devices in ways to save them money.
We’re also identifying frustration events in the data, typically where we’re observing “jamming patterns” where particular buttons are pressed obsessively over a short period of time. Likewise, we’re working to identify how sensory signals can be utilized to predict device failure, enabling a potentially interventionist strategy.
Q: What do you see as some of the most exciting developments in IoT so far?
DC: Overall, I’m excited to see many consumer durables and home goods entering the IoT breech. There are many gains to be made from power and environmental savings as well as safety by having such appliances monitored.
IoT has significant potential in fitness and health. EMR systems are largely incidence based—they track information when a patient has a problem, but fitness devices offer an opportunity for broadening an otherwise sparse dataset by quantifying fitness before a health incidence occurs.
There are significant opportunities for IoT within critical infrastructure pieces for our country and the world. Public transportation such as trains and planes stand to benefit from superior safety monitoring. Better monitoring can lead to alterations in operating policies which can also lead to better energy efficiencies. There are tremendous benefits within agriculture as well—farmers can now do a better job of tracking their crop “in flight,” meaning critical growth is at reduced risk for failure. These are only some of the ways that IoT technologies are being applied today.
Q: Where do you see this field going in the future?
DC: IoT is also a useful testbed for a broad class of robotics. Never before have we been able to collect so much data on behavior and activities at such a micro-level. Many of the biggest informatic developments of the last 20 years have been bootstrapped by creating data collection and tagging schemas, such as video and audio signal processing. In turn, collecting such voluminous data will enable robotics research to develop even better understandings of human interactions and activity, and allow them to make significant gains in this area over the next 20 years. Another rising area is Population Health, where we will develop better understandings of the influx of patients into particular healthcare facilities and practices.
Building a Data Warehouse
To perform interesting predictive or historical analysis of ever-increasing amounts of data, you first have to make it small. In our business, we frequently create new, customized datasets from customer source data in order to perform such analysis. The data may already be aggregated, or we may be looking at data across disparate data sources. Much time and effort is spent preparing this data for any specific use case, and every time new data is introduced or updated, we must build a cleaned and linked dataset again.
To streamline the data preparation process, we’ve begun to create data warehouses as an intermediary step; this ensures that the data is aggregated into a singular location and exists in a consistent format. After the data warehouse is built, it is much easier for our data scientists to create customized datasets for analysis, and the data is in a format that less-technical business analysts can query and explore.
Data warehouses are not a new concept. In our last blog post, we talked about the many reasons why a data warehouse is a beneficial method for storing data to be used for analytics. In short, a data warehouse can improve the efficiency of our process by creating a structure for aggregated data and allows data scientists and analysts to more quickly get the specific data they need for any analytical query.
A data warehouse is defined by its structure and follows these four guiding principles:
- Subject-oriented: The structure of a data warehouse is centered around a specific subject of interest, rather than as a listing of transactions organized by timestamps.
- Integrated: In a data warehouse, data from multiple sources is integrated into a single structure and consistent format.
- Non-volatile: A data warehouse is a stable system; it is not constantly changing.
- Time-variant: The term “time-variant” refers to the inclusion of historical data for analysis of change over time.
These principles underlie the data warehouse philosophy, but how does a data warehouse work in practice? We will explore two of the more concrete aspects of a data warehouse: how the data is brought into the warehouse, and how the data may be structured once inside.
Data Flow into a Warehouse
Most companies have data in various operational systems; marketing databases, sales databases, and even external data purchased from vendors. They may even have a data warehouse of their own for certain areas of their business. Unfortunately, it is next to impossible to directly compare data across various locations. In order to do such analysis, a great amount of effort is needed to get the data onto a common platform and into a consistent format.
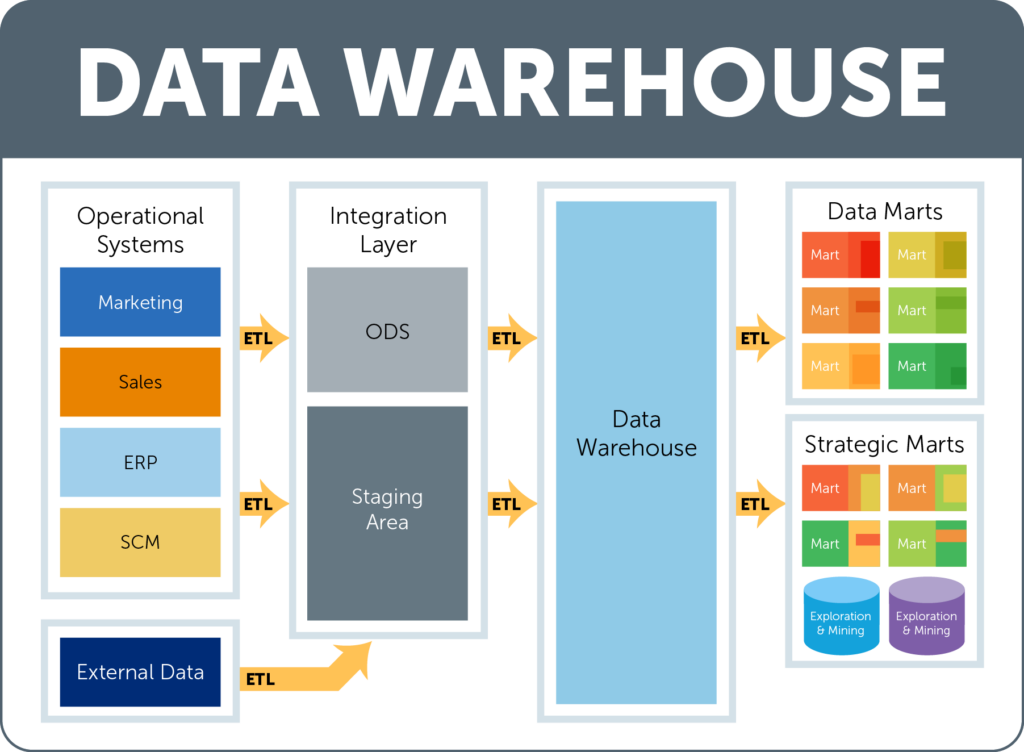
First, these disparate data sources must be combined into a common location. The data is initially brought to an area known as the integration layer. Within the integration layer, there is an ODS (operational data store) and a staging area, which work together (or independently at times) to hold, transform, and perform calculations on data prior to the data being added to the data warehouse layer. This is where the data is organized and put into a consistent format.
Once the data is loaded into the data warehouse (the structure of which we will discuss later on in the blog post), it can be accessed by users through a data mart. A data mart is a subset of the data that is specific to individual department or users and includes only the data that is most relevant to their specific use cases. There can be multiple data marts, but they all pull from the same data warehouse to ensure that the information that is seen is the most up-to-date and accurate. Many times, in addition to marts, a data warehouse will have databases specially purposed for exploration and mining. A data scientist can explore the data in the warehouse this way, and generate custom datasets on an analysis-by-analysis basis.
At every step of the way, moving the data from one database to another involves using a series of operations known as ETL, which stands for extract, transform, and load. First, the data must be extracted from the original source. Next, that data is transformed into a consistent format, and finally, the data is loaded into the target database. These actions are performed in every step of the process.
Data Warehouse Structure
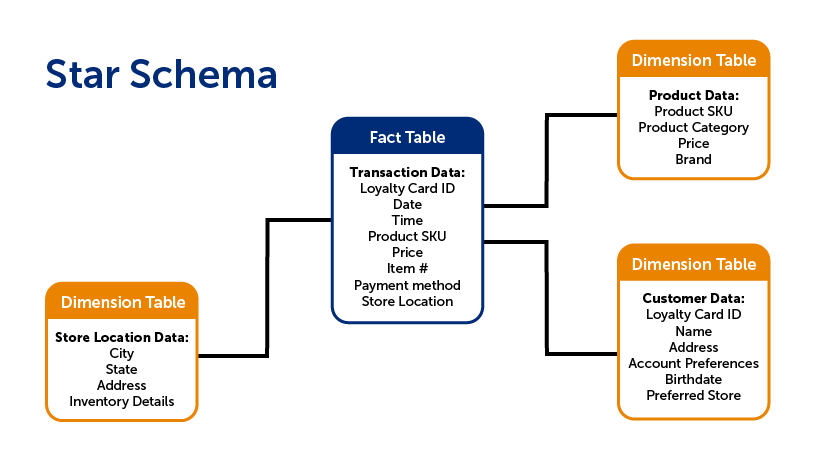
There are a few different ways that the data within the warehouse can be structured. A common way to organize the data is to use what is called a star schema. A star schema is composed of two types of tables: fact tables and dimension tables.
Fact tables contain data that corresponds to a particular business practice or event. This would include transaction details, customer service requests, or product returns, to name a few. The grain is the term for the level of detail of the fact table. For instance, if your fact table recorded transaction details, does each row include the detail of the transaction as a whole, or each individual item that was purchased? The latter would have a more detailed grain.
While fact tables include information on specific actions, a dimension table, on the other hand, includes non-transactional information that relates to the fact table. These are the items of interest in analytics: data on each individual customer, location/branch, employee, product, etc. In other words, the dimension is the lens through which you can examine and analyze the fact data.
There are typically far fewer facts, which are “linked” to the various dimension tables, forming a structure that resembles a star, hence the term star schema.
A snowflake schema is similar to the star schema. The main difference is that in a snowflake schema, the dimension tables are normalized--that means that the individual dimension tables from the star schema are re-organized into a series of smaller, sub-dimension tables which reduces data redundancy. This is done so that the same information isn’t stored in multiple tables, which makes it easier to change or update the information since it only has to be change in one location. The downside of the snowflake schema is that it can be complicated for users to understand, and requires more code to generate a report. Sometimes it is best to maintain a de-normalized star schema for simplicity’s sake.
Conclusion
These are just the basics of how data flows into a data warehouse, and how a warehouse could be structured. While the star and snowflake schemas are not the only way (there is also a newer schema called a Data Vault), they do provide a standardized way to store and interact with historical data. Ultimately, a well-organized data warehouse allows data scientists and analysts to more easily explore data, ask more questions, and find the answers they need in a more timely fashion.
