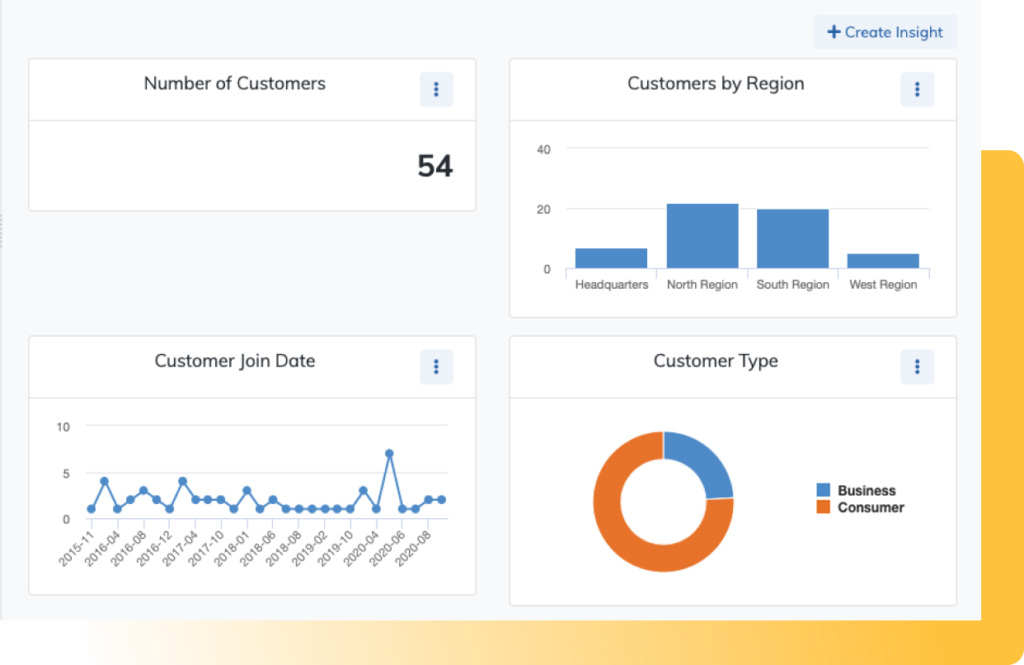
 Daybreak™ Insights provide best-in-industry value for analytics platforms by integrating data visualization to display results of AI and Machine Learning powered analytics assessment of your data. Daybreak exists to enable anyone to get data-driven answers to their questions. With easy-to-use tools like Daybreak Natural Language Answers, users without a background in database technology can generate result sets from their data by simply asking questions about the data. No coding, or technical knowledge of databases, datamarts, SQL queries or how to get your data prepped and ready for analysis is needed. Insights are revealed based upon your data in the form of lists of customer records that match your query and also by visualizations to display those results in various graphical forms like line, donut, or bar charts. This tool provides similar capabilities to dedicated BI tools like Tableau or PowerBI, and is available as part of Daybreak. Daybreak also allows you to export analytic results to your favorite BI visualization tool, where your team may have already built custom views and dashboards.
Insights are a valuable way to share stories about data with other members of your organization. The Daybreak Insights dashboard enables you to build a custom dashboard for saved queries, and then share that dashboard with other Daybreak users on your team. Insights can also be saved as downloadable graphics for inclusion in other documents or slideshows to accelerate and automate data-driven presentations.
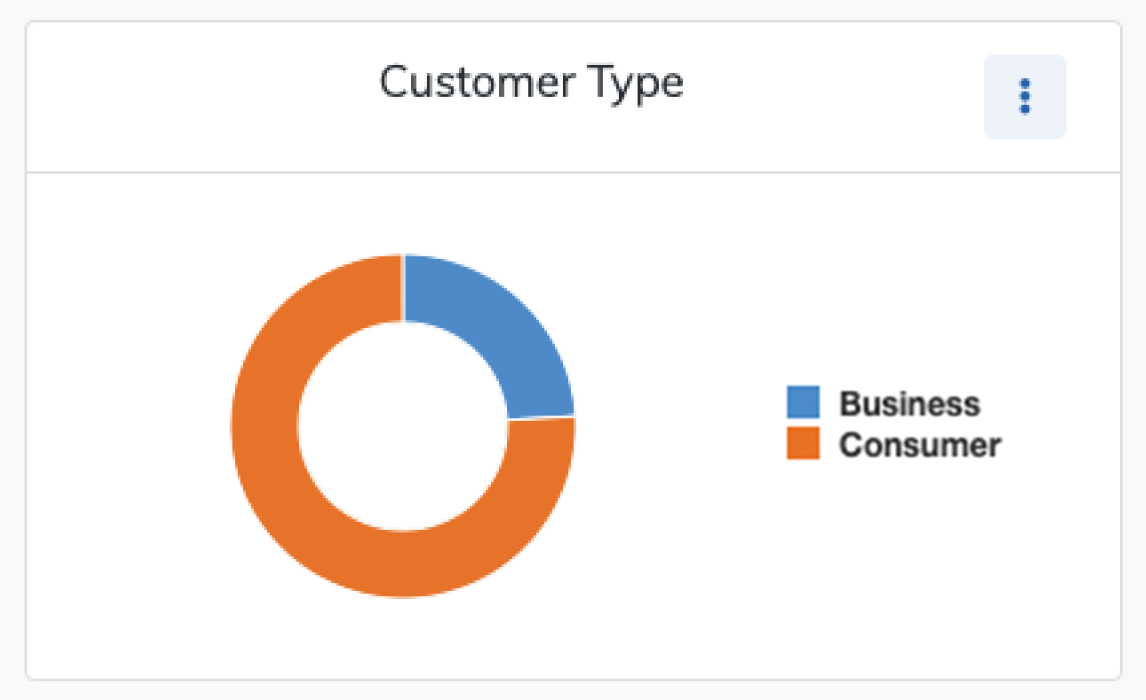
Figure 1: Daybreak Insight showing the proportion of business vs. consumer customers
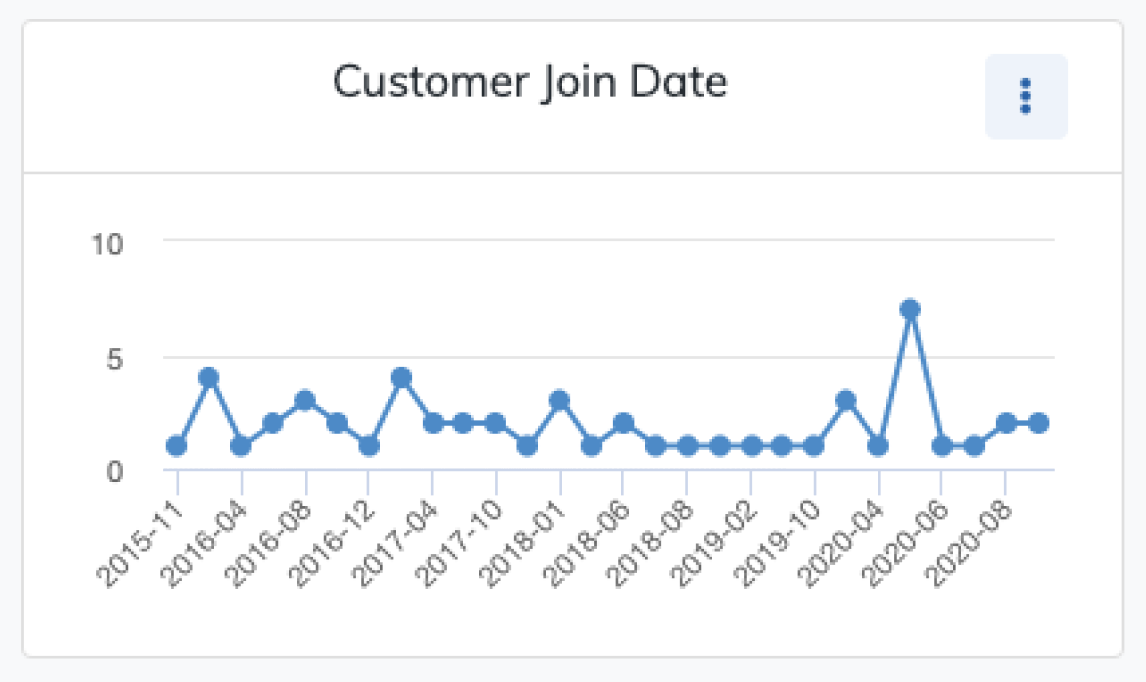
Figure 2: Daybreak Insight showing the number of customers joining over time
Daybreak Insights are easy to create. Simply click the “Insights” tab to add an Insight. Daybreak supports different kinds of charts to display different kinds of data, like timeseries line charts, column or donut charts, or summary metrics to display simple calculations based on fields. Each type of Insight has its own settings that can be configured to control how the charts are drawn. The value of each axis or segment can be simple counts of records, or aggregations based on arithmetical or statistical operations like sums, minimums, maximums, or averages.
Insights are one of the many ways Aunalytics provides data-driven answers to your most important business and IT questions.