Daybreak Dashboards for Financial Institutions
Find opportunities in your data and act on them. Daybreak’s pre-built dashboards give you actionable insights that provide real business value.
Daybreak dashboards:
Customer Profile Dashboard
View an enriched profile for each of your customers.
The Customer Profile dashboard provides a 360-degree view of each customer including analysis of data integrated from multiple sources across your institution, mined daily for timely fresh insights for you to act upon. AI-powered insights give you knowledge for future customer growth beyond mere aggregations and reports of the past.
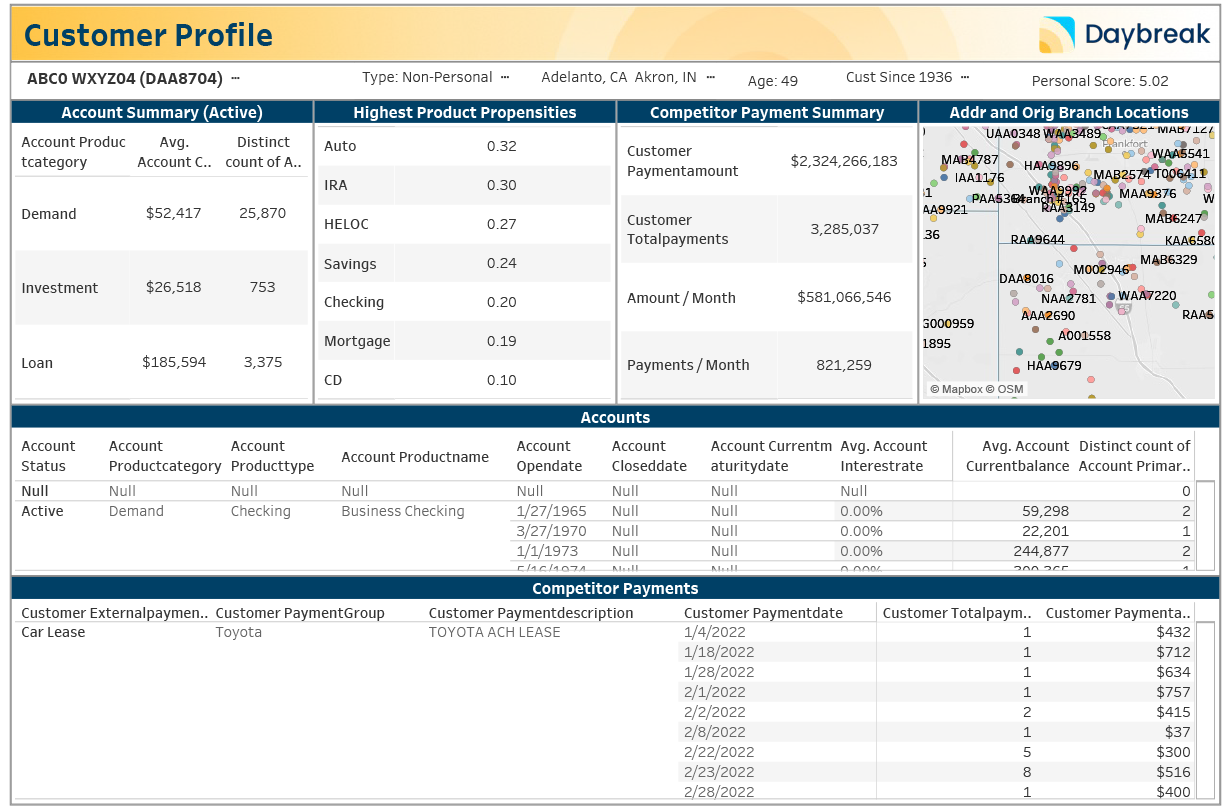
With the Customer Profile dashboard you can:
View which accounts your customer has with competitors so you can make a more attractive offer to win business and grow customer value.
View the next best product to offer your customer today based upon their transactional behavior.
See which branches your customer uses for deeper understanding of your customer beyond origination branch.
Competitor Payments Dashboard
Grow net deposits and stop money from leaving your financial institution.
Daybreak’s Competitor Payments dashboard reveals AI-powered insights on the external payments leaving your bank to go to competitor financial institutions. Insights for each customer, each competitor, and type of financial product allow you to create better offers when your customer is most likely to look for a new product.
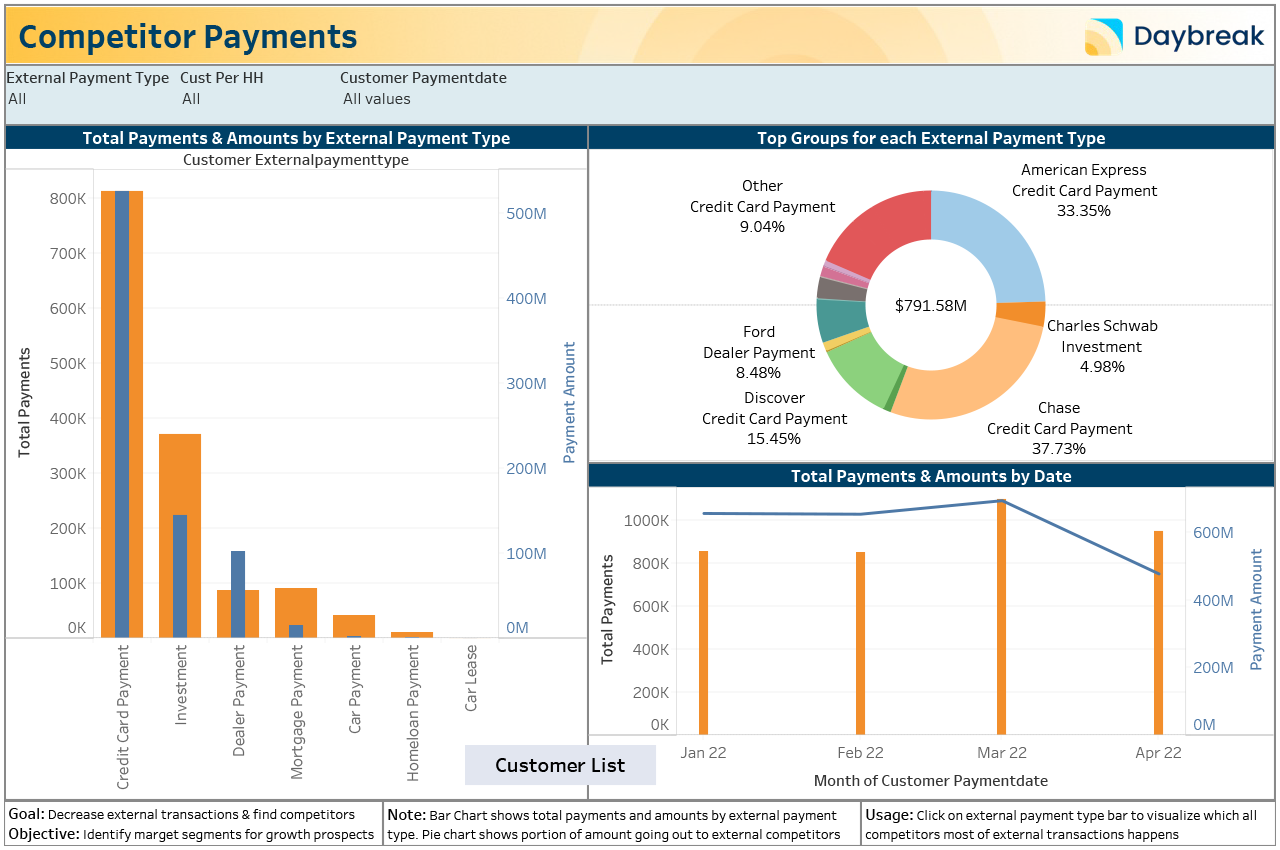
With the Competitor Payments dashboard you can:
Decrease external transactions and find competitors.
Identify market segments for growth prospects.
Know how much money is leaving your financial institution to go to your competitors.
Retail KPI Dashboard
Understand the drivers of retail account and deposit growth.
The Retail KPI dashboard provides data for overall institution performance and detailed performance of each region, branch, market, product type and individual product to identify opportunities for growth and understand which branches are driving change.
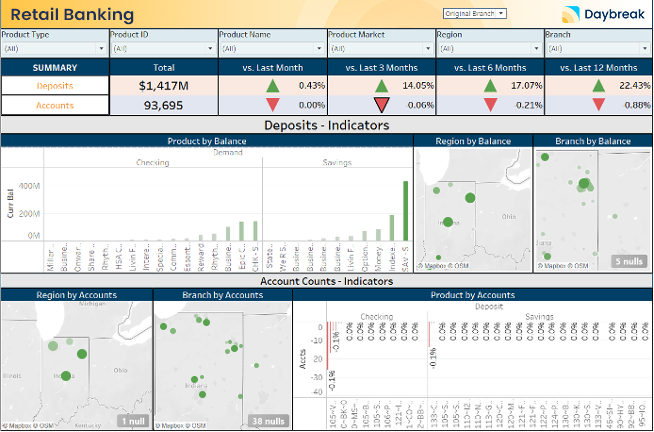
With the Retail KPI dashboard you can:
Analyze deposits and balances over time and understand growth trends.
Increase total deposits and accounts.
Identify growth opportunities and potential.
Lending KPI Dashboard
Understand the drivers of loan growth and trends for loan balances.
The Lending KPI dashboard provides data for overall institution lending performance and detailed performance of lending by branch, region, market, product type and each product to identify opportunities for growth and understand which products, team members and branches are driving growth.
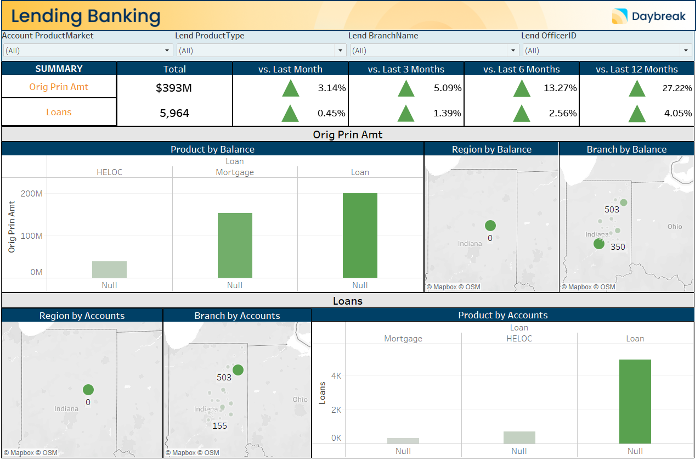
With the Lending KPI dashboard you can:
View trends over time for original loan amounts and outstanding loan balances.
Increase lending by identifying growth opportunities and potential in lending.
View performance insights by team member and shows loans closed and principle amounts over time.
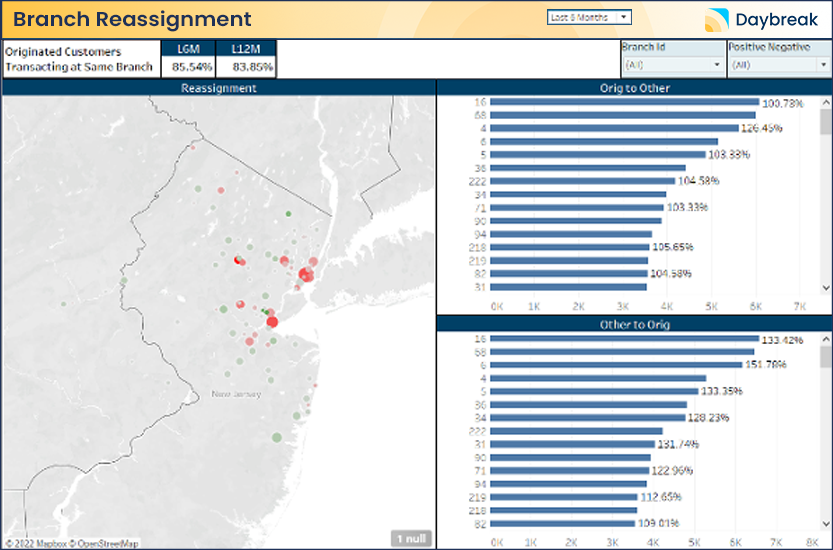
Branch Reassignment Dashboard
Understand branch utilization and change over time.
The Branch Reassignment dashboard allows business leaders to identify branch growth opportunities and areas of opportunity for efficiencies. Patterns of customer migration between branches are revealed by looking at which customers are transacting at a branch versus the number of origination customers credited to that branch. Knowing which of your customers are banking at which branch allows you to identify the products to market at that branch to target offers to customers likely to need that product.
With the Branch Reassignment KPI dashboard you can:
View branch utilization across all branches and drill down on each branch to understand customer banking patterns.
Improve branch operational planning by reassigning customers from their origination branch to where they actually are doing their banking today.
Understand branch utilization trends to better plan for staffing and identify opportunities for where to open or move branch locations.
Marketing KPI Dashboard
Target your institution’s marketing efforts to reach the right customer at the right time with the right offer.
The Marketing KPI dashboard makes marketing operations more efficient and increases wins by enabling a data-driven approach. Measure both direct and indirect impact of your campaigns. View by region, branch and customer tenure to segment and target audiences for future marketing campaigns that get results.
With the Marketing KPI dashboard you can:
Track campaign performance by resulting deposits and new accounts.
Understand customer acquisition cost by region, branch and product type.
Assess account and balance growth by region, branch, and product type.
Understand new account demographics.
Filter insights by campaign type, communication channel, product type and more.
Measure both direct and indirect impact of your campaigns in new accounts opened.