
Building a Data Warehouse
To perform interesting predictive or historical analysis of ever-increasing amounts of data, you first have to make it small. In our business, we frequently create new, customized datasets from customer source data in order to perform such analysis. The data may already be aggregated, or we may be looking at data across disparate data sources. Much time and effort is spent preparing this data for any specific use case, and every time new data is introduced or updated, we must build a cleaned and linked dataset again.
To streamline the data preparation process, we’ve begun to create data warehouses as an intermediary step; this ensures that the data is aggregated into a singular location and exists in a consistent format. After the data warehouse is built, it is much easier for our data scientists to create customized datasets for analysis, and the data is in a format that less-technical business analysts can query and explore.
Data warehouses are not a new concept. In our last blog post, we talked about the many reasons why a data warehouse is a beneficial method for storing data to be used for analytics. In short, a data warehouse can improve the efficiency of our process by creating a structure for aggregated data and allows data scientists and analysts to more quickly get the specific data they need for any analytical query.
A data warehouse is defined by its structure and follows these four guiding principles:
- Subject-oriented: The structure of a data warehouse is centered around a specific subject of interest, rather than as a listing of transactions organized by timestamps.
- Integrated: In a data warehouse, data from multiple sources is integrated into a single structure and consistent format.
- Non-volatile: A data warehouse is a stable system; it is not constantly changing.
- Time-variant: The term “time-variant” refers to the inclusion of historical data for analysis of change over time.
These principles underlie the data warehouse philosophy, but how does a data warehouse work in practice? We will explore two of the more concrete aspects of a data warehouse: how the data is brought into the warehouse, and how the data may be structured once inside.
Data Flow into a Warehouse
Most companies have data in various operational systems; marketing databases, sales databases, and even external data purchased from vendors. They may even have a data warehouse of their own for certain areas of their business. Unfortunately, it is next to impossible to directly compare data across various locations. In order to do such analysis, a great amount of effort is needed to get the data onto a common platform and into a consistent format.
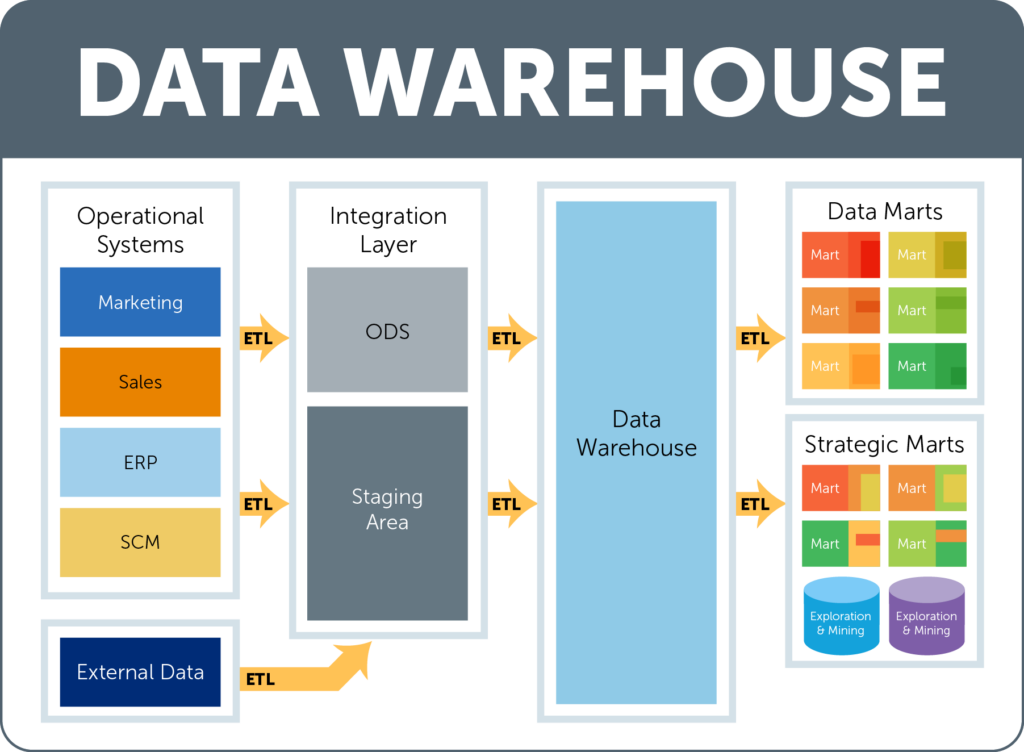
First, these disparate data sources must be combined into a common location. The data is initially brought to an area known as the integration layer. Within the integration layer, there is an ODS (operational data store) and a staging area, which work together (or independently at times) to hold, transform, and perform calculations on data prior to the data being added to the data warehouse layer. This is where the data is organized and put into a consistent format.
Once the data is loaded into the data warehouse (the structure of which we will discuss later on in the blog post), it can be accessed by users through a data mart. A data mart is a subset of the data that is specific to individual department or users and includes only the data that is most relevant to their specific use cases. There can be multiple data marts, but they all pull from the same data warehouse to ensure that the information that is seen is the most up-to-date and accurate. Many times, in addition to marts, a data warehouse will have databases specially purposed for exploration and mining. A data scientist can explore the data in the warehouse this way, and generate custom datasets on an analysis-by-analysis basis.
At every step of the way, moving the data from one database to another involves using a series of operations known as ETL, which stands for extract, transform, and load. First, the data must be extracted from the original source. Next, that data is transformed into a consistent format, and finally, the data is loaded into the target database. These actions are performed in every step of the process.
Data Warehouse Structure
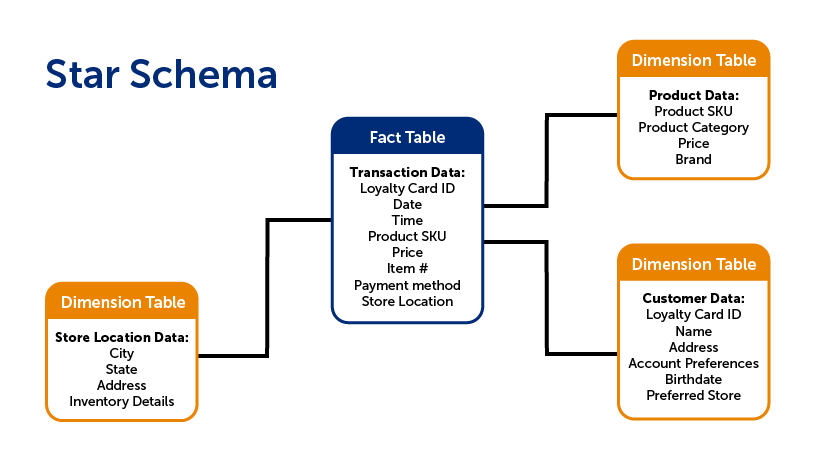
There are a few different ways that the data within the warehouse can be structured. A common way to organize the data is to use what is called a star schema. A star schema is composed of two types of tables: fact tables and dimension tables.
Fact tables contain data that corresponds to a particular business practice or event. This would include transaction details, customer service requests, or product returns, to name a few. The grain is the term for the level of detail of the fact table. For instance, if your fact table recorded transaction details, does each row include the detail of the transaction as a whole, or each individual item that was purchased? The latter would have a more detailed grain.
While fact tables include information on specific actions, a dimension table, on the other hand, includes non-transactional information that relates to the fact table. These are the items of interest in analytics: data on each individual customer, location/branch, employee, product, etc. In other words, the dimension is the lens through which you can examine and analyze the fact data.
There are typically far fewer facts, which are “linked” to the various dimension tables, forming a structure that resembles a star, hence the term star schema.
A snowflake schema is similar to the star schema. The main difference is that in a snowflake schema, the dimension tables are normalized--that means that the individual dimension tables from the star schema are re-organized into a series of smaller, sub-dimension tables which reduces data redundancy. This is done so that the same information isn’t stored in multiple tables, which makes it easier to change or update the information since it only has to be change in one location. The downside of the snowflake schema is that it can be complicated for users to understand, and requires more code to generate a report. Sometimes it is best to maintain a de-normalized star schema for simplicity’s sake.
Conclusion
These are just the basics of how data flows into a data warehouse, and how a warehouse could be structured. While the star and snowflake schemas are not the only way (there is also a newer schema called a Data Vault), they do provide a standardized way to store and interact with historical data. Ultimately, a well-organized data warehouse allows data scientists and analysts to more easily explore data, ask more questions, and find the answers they need in a more timely fashion.
