
Why Using a Data Warehouse Optimizes Analytics
Beginning an analytics project is no small task. After choosing the initial question to be answered and formulating a plan of actions to be taken as a result, the next logical step is to complete an inventory of the available data sources and determine what data is needed to reach the decided-upon analysis goal.
It’s common for a company to have many different databases containing a wide variety of information. To gain a complete view of of a company through analytics, data from many sources is aggregated to one place. A company may have transaction data in one database, customer information in another, and website activity logs in yet another. Bringing all of this data together is a critical part of any analytics project; however, it poses two major challenges.
The first challenge: data is messy. When aggregating data from different sources, the formatting of data points is frequently inconsistent, data may be missing from multiple fields, or the databases may have completely different schemas. In order to build any kind of predictive model or historical analysis, data must be cleaned and organized. This process can be very difficult and time consuming.
The second challenge: analytics requires hardware and software that is powerful and flexible. Most business people have experience running reports and looking at short-term trends. However, data scientists are looking at the bigger picture. They may be sifting through months, or even years, worth of data to uncover trends.
This means that for an analytics project, the data must be stored in a system that has the ability and computing power to comb through thousands of rows of data. The system must also allow data scientists and analysts the flexibility to run a wide variety of queries. Advanced analytics is a journey of discovery; the question being answered may evolve over time as new trends are discovered. Each inquiry leads to new questions as the company journeys deeper into analytics.
Because of these constraints, it is important to consider the physical and virtual structure surrounding the data. Setting up the most efficient structure for the job at hand is the best way to optimize any project. We will go through two ways to manage data for analytics:
One Way to Do It
Data cleaning and linking is time-consuming. In the interest of time, it may seem that the quickest way to get a desired answer is to prepare only the data that is actually needed for a given analysis. Data scientists spend large amounts of time preparing the data, so why waste time aggregating, cleaning and linking data that won’t be used?
Because analytics never stops at a single question and answer (and, as software engineers know, requirements often change many times before the final product is released), a project-specific cleaned and linked dataset may need to be altered many times. A subsequent or new question may involve the use of additional or completely different data points. The relevant data must be cleaned, linked, and organized from the source databases all over again. This especially becomes an issue when the question at hand requires the most up-to-date information. Each time new data is included, the dataset must be updated or completely re-generated and linked. Think of how many new, ad hoc datasets would be created from source data over the lifetime of the analytics project!
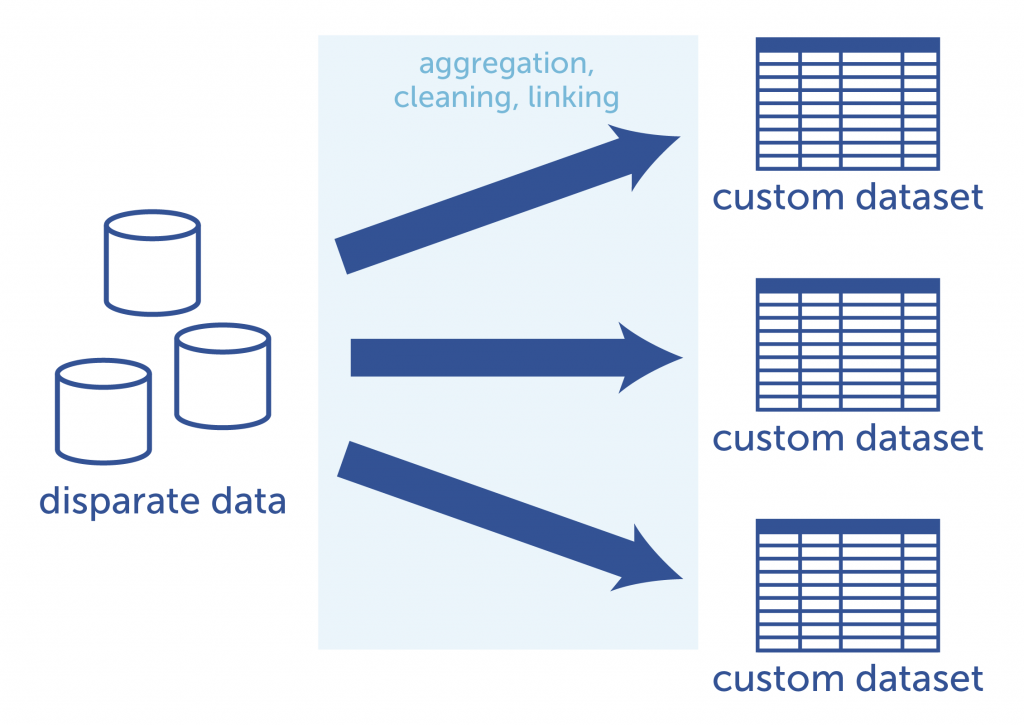
Each analytics project requires a new custom dataset to be created from
the source databases. This requires time and effort to achieve.
A Better Way
It is important to think of the bigger picture when it comes to data analysis. It is highly unlikely that an analyst or data scientist will ever stop with one question. So, instead of creating specialized datasets for analysis on an ad hoc basis, it is more efficient in the long run to create an integrated, linked, and cleaned data warehouse to house the entirety of the data. From there, a data scientist or analyst can build custom datasets for their analyses. Because the data is pre-cleaned and stored in an organized manner, it is relatively simple for a data scientist or analyst to select the pieces of information needed to create an analytics-ready dataset on the fly.
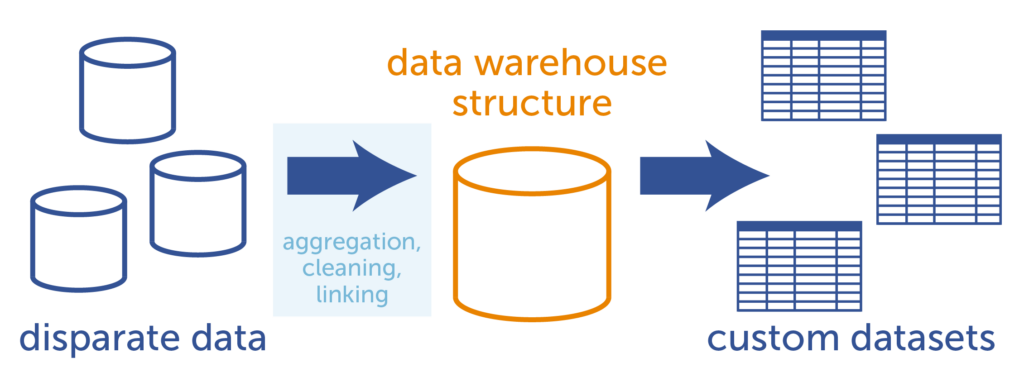
With a data warehouse, the disparate data is aggregated, cleaned, and linked into a single database structure.
From there, custom datasets for analytics are generated more easily.
Data Warehouse vs. Transactional Databases
The term “data warehouse” refers to a philosophy on creating a relational database system that is optimized for query operations and analyses. This differs from other database systems in a number of ways.
Most organizations that are collecting data have at least one (and sometimes many) online transaction processing (OLTP) databases. An OLTP database is used to collect transactional data, and is designed to work well when new records are added frequently, in real time. An example would be a database that collects website click information, or logs every time a customer makes a purchase. These databases give users the ability to perform only a few, set operations because the majority of the computing workload is devoted to recording new transactions in real-time. To keep an OLTP database at top speed, older data is frequently archived. Since analytics requires historical data and the ability to run a variety of exploratory operations on the data, this is not the ideal type of environment for an analysis to occur.
A data warehouse, on the other hand, is focused on analysis rather than recording data in real-time. This give the analyst or data scientist the computing power and flexibility needed to explore historical data to find deeper trends.
There are four guiding principles for data warehouse systems, as defined by the father of data warehousing, William Inmon:
- Subject-oriented: The structure of a data warehouse is centered around a specific subject of interest, rather than as a listing of transactions organized by timestamps. For instance, a data warehouse might have the transactions organized, instead, by the customer who made the transaction. (This would be what we call an “atom-centric” view, with the customer as an atom.) An analyst or data scientist can look for trends in customer transactions over time, and draw comparisons between similar customers and their transaction histories.
- Integrated: In a data warehouse, data from multiple sources is integrated into a single structure and consistent format. In the process of integration, naming conflicts are resolved, units of measure are converted into a consistent format, and missing data may be replaced.
- Non-volatile: A data warehouse is a stable system. Unlike an OLTP database, data is not constantly being added or changed.
- Time-variant: The term “time-variant” refers to the inclusion of historical data for analysis of change over time. Since a data warehouse includes all data rather than just a snapshot of the most recent transactions, a data scientist can begin to search long-term trends.
As you can see, there are many benefits to using a data warehousing system for analytics. The idea was conceived with analytics in mind, and this type of database structure can speed the time to insights, especially when pursuing subsequent analytics projects. A data warehouse allows data scientists and analysts to spend more time deeply exploring the data, rather than wasting precious hours on data preparation.
Conclusion
Building a data warehouse is the best long-term solution for an advanced analytics program. But how does a data warehouse work, and how to data scientists go about building them? Stay tuned. In a future blog post, we will discuss some of the more technical aspects of data warehouses: how they are built and updated; and the various ways to structure the data to optimize analytics.
